In this guide, I will show you how to perform data normality tests in GraphPad Prism. Prior to any statistical analysis, the first thing you should do is to see whether your data is normally distributed. These will reveal more about the dataset and ultimately help in deciding which statistical test you should perform.
What are the normality tests?
Normality tests are statistical ways to indicate whether the data was drawn from a normal population.
They should not be used in isolation, rather, they should be used in conjunction with plots to help interpret the distribution of the data.
Which normality test should you perform?
GraphPad Prism allows for the option of three normality tests.
- D’Agostino-Pearson omnibus
- Shapiro-Wilk
- Kolmogorov-Smirnov
So, which one should you go for? It is recommended to use the D’Agostino-Pearson omnibus test since it is easier to understand how it works. The Shapiro-Wilk test is useful when no two values are the same in the dataset. Finally, the general consensus is to avoid the use of the Kolmogorov-Smirnov test, as it is now redundant.
Note, that there are a minimum number of samples you need to be able to perform the normality tests (n = 8 for D’Agostino-Pearson omnibus, n = 3 for Shapiro-Wilk and n = 5 for Kolmogorov-Smirnov).
I recommend reading the Q&A: Normality Tests sheet on the GraphPad website for more information section on normality tests
The dataset
For this example, I will use the following dataset contained within a column table. I have two groups of data: males and females ages in years.

How to perform normality tests in GraphPad Prism
Here is how you can perform normality tests in GraphPad Prism.
- In the data table view, click the
Analyzebutton in theAnalysissection of the ribbon at the top.
 2. The
 Analyze Data window should now open. Click the Column analyses dropdown option, and under these options select Column statistics. On the right-hand window, select the datasets which you want to analyze. Those with a tick will be included in the analysis. Then, click the OK button.
 3. The
 Parameters: Column Statistics should now open. This window enables you to specify what to report in the analysis, and most importantly, what normality test(s) to perform. You can find these tests under the Test if the values come from a Gaussian distribution header. Select which test(s) you want to perform by clicking them and then click the OK button. For the purpose of this example, I will select the D’Agostino-Pearson omnibus normality test and the Shapiro-Wilk normality test.
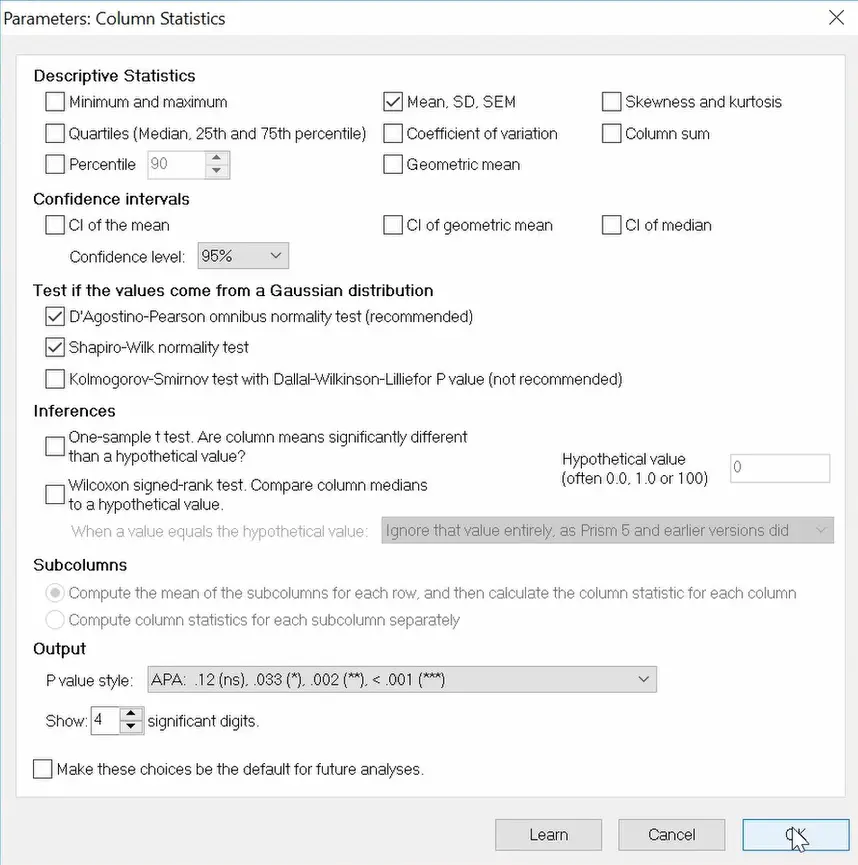
4. Click the OK button to run the normality tests.
The output
A new results sheet should now open. The results of the normality tests should be reported near the bottom of this sheet.
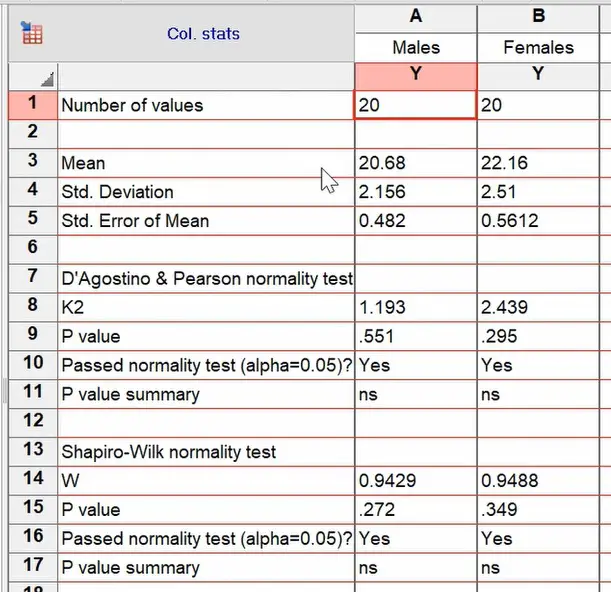
The results of each test can be broken down into four lines.
The test statistics (K2 or W):These are the test statistics for the corresponding normality test.P value:The P value for each test.Passed normality test (alpha = 0.05)?:A simple ‘Yes’ or ‘No’ answer stating whether the tests are significant or not if the level of significance is set at 0.05.P value summary:The P value asterisk level, if the test was significant.
Interpretation
The beauty of GraphPad Prism is that the interpretation of their statistical analysis is so easy. Obviously, the first thing to look at is the P value row to get the significance value. In all of the tests above, they are above 0.05. Therefore, according to these tests, the data is normally distributed. If it was less than 0.05, then the data will not be normally distributed.
To interpret this more, the Passed normality test (alpha = 0.05) will state is the normality tests have passed, which they have done in this example.
Other ways to investigate normality
There are other useful ways to investigate the distribution of data to decide whether it is normally distributed or not, other than normality tests. These include histogram plots and Q-Q plots, which are visual tests that are easy to interpret.
GraphPad Prism version used: 7


Hello can you help me? I use version 5 and nowhere can I find the Barlet`s Test
Hi Clarice,
Is the Bartlett’s test now available in the post-hoc tests option? Maybe this is in a different version of Prism, but I would have thought it was in Prism 5.
Nice.
This GraphPad faq gives more depth and nuance:
https://www.graphpad.com/support/faqid/959/
Note that a normality test doesn’t and can’t test if data are Gaussian. That is vague. It tests whether data are sampled from a Gaussian distribution. With a high P value, you don’t have evidence that the data are not sampled from a Gaussian distribution. P values require double negatives!
Hi Harvey,
Many thanks for the link and helpful comments. I have updated the article to contain the link. 🙂
Best wishes,
Steven