What is a Pearson correlation?
A Pearson correlation, also known as a Pearson Product-Moment Correlation, is a measure of the strength for an association between two linear quantitative measures.
For example, you can use a Pearson correlation to determine if there is a significance association between the age and total cholesterol levels within a population. This is the example I will use for this guide.
Assumptions of a Pearson correlation test
There are just a few assumptions that data has to meet before a Pearson correlation test can be performed. There are:
- The two variable of interest are continuous data (interval or ratio).
- The two variables should be approximately normally distributed. Refer to our guide on normality testing in SPSS if you need help with this.
- There should be a linear relationship between the two variables. Plot them on a scatterplot to see their association.
- There should be no outliers present.
How to perform a Pearson correlation in SPSS
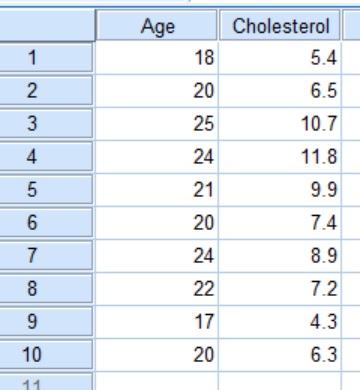
I have created a simple dataset containing 10 rows of data, each row signifies one person. I have two variables, the first being Age (in years) and the other being blood total Cholesterol levels (in mmol/L).
 For this example, the null hypothesis is:
There is no correlation between participant ages and blood total cholesterol levels.
On the other hand, the alternative hypothesis would read:
There is a correlation between participant ages and blood total cholesterol levels.
Performing the test
- Within SPSS, go to
Analyze > Correlate > Bivariate.
 A new window will open called
 Bivariate Correlations. Here, you need to specify which variables you want to include in the analysis.
Drag both variables from the left window, to the right window called Variables. In this case, both Age and Cholesterol will be moved across. Note, that you can drag more than two variables into the test, with each combination possible being tested for at the same time.
2. Ensure that Pearson is ticked under the title Correlation Coefficients. Since we have not made any prior assumptions, we will also leave the Test of Significance as Two-tailed.
 3. Click the
 OK button to run the test.
Output
By going to the SPSS Output window, there will be a new heading of Correlations with a correlation matrix displayed.
 Within the grid, there are three pieces of information which are listed below.
Pearson Correlation– This is the Person Correlation Coefficient (r) value. These values range from 0 to 1 (for positive correlations) and -1 to 0 (for negative correlations). The larger the number, the stronger the linear association between the two variables i.e. a value of 1 indicates a strong positive association and a value of -1 indicates a strong negative association. A value of 0 indicates no such association.Sig. (2-tailed)– The P value for a two-tailed analysis.N– The number of pairs of data in the analysis.
Interpretation
By looking at the results in the above table, it can be seen that the correlation between age and blood cholesterol levels gave a Pearson Correlation Coefficient (r) value of 0.882, which indicates a strong positive association between the two variables. Also, the P value of the association was 0.001, thus indicating a highly significant result. Therefore, I will reject the null hypothesis.
Reporting
When reporting the results of a Pearson Correlation, it is useful to quote two pieces of data: the r value (the correlation coefficient) and the P value of the test. For the example above this could read:

IBM SPSS version used: 23


It was easy to understand and easy to apply. It is very helpful for novices like us. Thank you so much for the easy tutorial.
Straight to the point and very helpful. Thank you Dr. Steven
Thank you Dr. Steven Bradburn, it was easy to understand and helpful for me.
Thank you for your kind words. I’m glad you found it useful