In this guide, I will explain how to identify and remove outliers by using GraphPad Prism.
To remove or not remove outliers?
Outliers are data points which are distinctly different from the rest. The definition can vary depending upon the method used.
The main reason for removing outliers is simply because they can interfere with the assumptions of certain statistical tests; this is especially true in small data sets.
It is best to decide if you are going to incorporate outlier testing in your statistical analyses before perform your experiment.
Lastly, it may be worth transforming the data in GraphPad, rather than removing outliers, to see if this helps improve the distribution of your data.
How to identify and remove outliers in GraphPad
The example data
For this example, I have a set of 22 replicates stacked into a column data sheet.
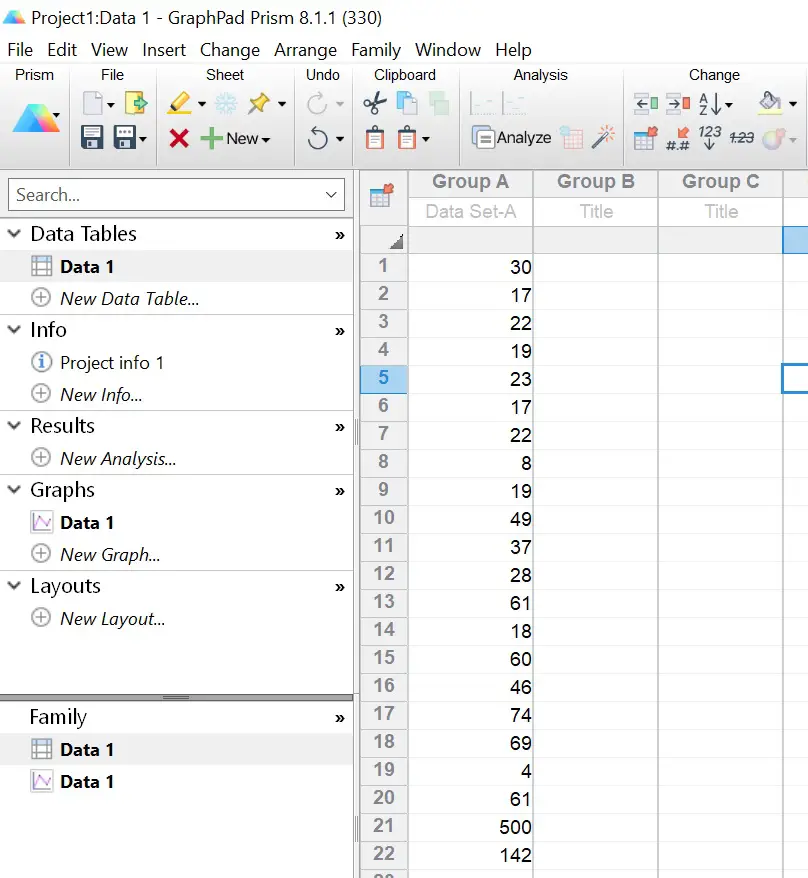
The aim, therefore, is to test to see if there are any outliers in this dataset and to remove them.
Let’s begin
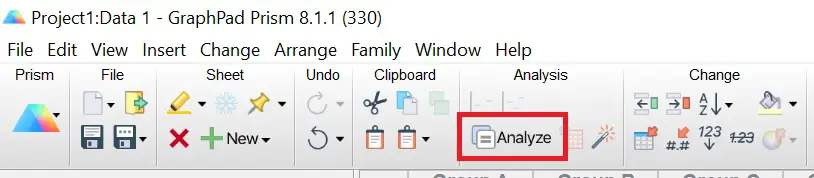
1. To test data for outliers in GraphPad, click the ‘Analyze‘ button.
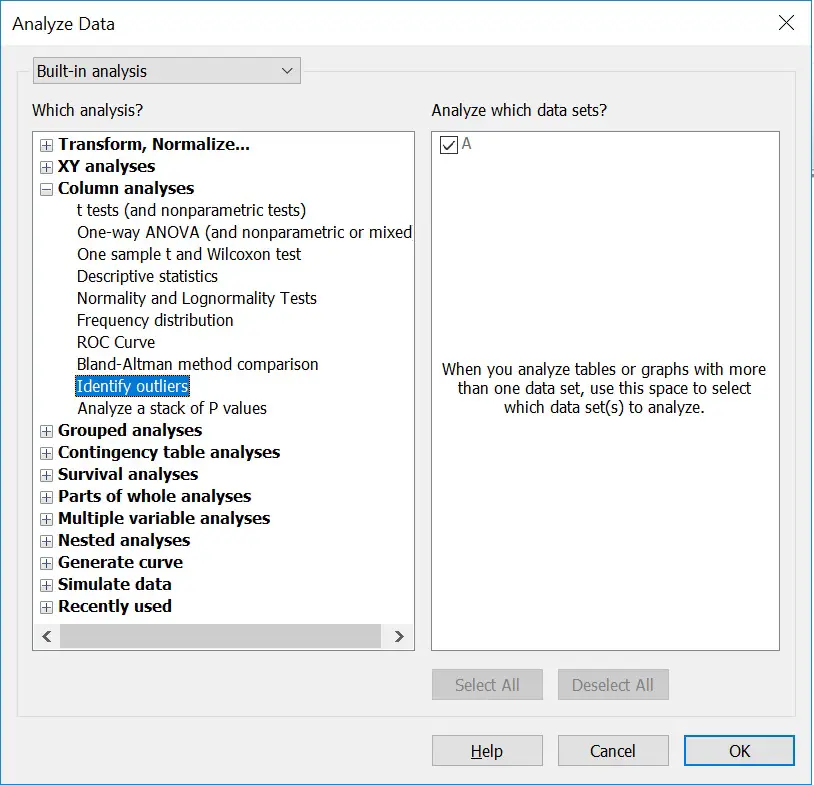
2. Under the ‘Column analyses‘
3. The ‘Parameters: Identify Outliers‘ window will now open. This is where you specify the method of outlier detection as well as selecting how aggressive you want to be in their removal.
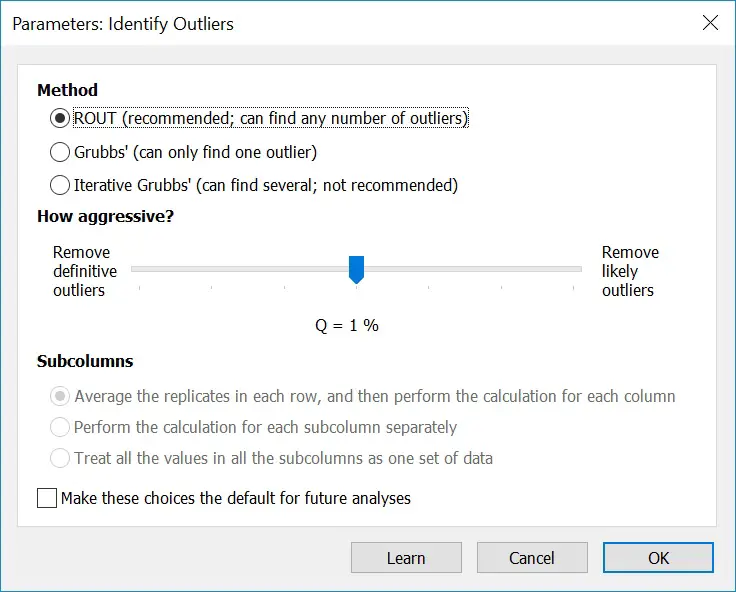
There are 3 methods available in GraphPad to identify and remove outliers: ROUT, Grubbs’ and Iterative Grubbs’.
Note that these methods assume your data has been sampled from a Gaussian distribution. So, ensure to test your data for normality in GraphPad before proceeding.
The ROUT method
The ROUT method can be used to find any number of outliers. This method was developed by GraphPad and is based on the False Discovery Rate (FDR). To learn more about the ROUT method, have a read of the published manuscript.
For this method, Q is specified. Q is the maximum desired FDR. Think of this value as being the maximum percentage of outliers that are false.
It is recommended to use the ROUT method when wanting to detect multiple outliers.
Grubbs’ method
The Grubbs’, also known as the Extreme Studentized Deviate,
For the Grubbs’
It is recommended to only use the Grubbs method when you are certain your data contains either one or no outliers.
Iterative Grubbs’ method
The Iterative Grubbs’ method is based on the prior namesake, but can detect more than one outlier.
It does so by simply repeating the Grubbs’ method using the cleaned data to detect a further outlier and repeats the process until no further outliers are present.
It is advised to avoid using this method altogether.
How aggressive should you be in outlier removal?
The next step when removing outliers in GraphPad is to determine how aggressive you want to be in the process. This is achieved by dragging the slider left or right.
Simply, placing the slider further to the left will apply a more aggressive approach and will remove
Deciding on where to place the slider is user dependent.
It is recommended to start at Q = 1% if using the ROUT method. If using the Grubbs’ method, start at Alpha = 0.01.
4. If you have subcolumns in your data set, these options will be available. Here you can decide to average the replicates beforehand, perform the tests for each subcolumn separately or treat all of the values as a one data set.
5. When you have selected the outlier method and specified how aggressive you will be in their removal, click the ‘OK‘ button to run the test.
The results
The outputs of the outlier test are entered into a new results sheet, split into three tabs: Summary, Outliers and Cleaned data.
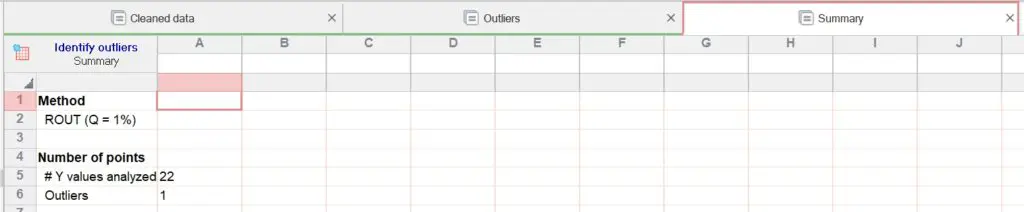
Summary
In the Summary tab, the method used and the number of outliers will be recorded. In this example, the ROUT method was used with a Q value of 1%. From the 22 data points tested, a single outlier was identified.
Outliers
In this tab, the outliers will be recorded. These are listed with their location in the data set and their actual value.
Cleaned data
In the Cleaned data tab, all of the data will be returned without the outliers. You can, therefore, treat this results sheet as a new data table to perform further statistical tests without the outliers in there.
Conclusion
In this tutorial, I have shown you how to identify and remove outliers in GraphPad Prism. From the three tests available, it is advised to use the ROUT method when detecting multiple outliers.
Be wary when deciding to remove outliers. Consider if outlier testing will be part of your analyses before you collect data.
GraphPad Prism version used: 8.1.1


