In this tutorial I will explain how to use GraphPad Prism to add lines with text to depict statistical significance between datasets on graphs.
What are significance lines?
I don’t believe the correct term is significance lines; but I am going to use this hereafter.
I’m talking about the horizontal, and sometimes zig-zag, lines that are added onto graphs to indicate when

How to add significance lines and symbols to graphs in Prism
Adding significance lines and symbols is incredibly easy in Prism! Simply follow the steps below.
With the graph open in Prism, click on the draw tool at the top. There are a plethora of options available; however, the ones that concern us are the ‘lines with text‘ options.
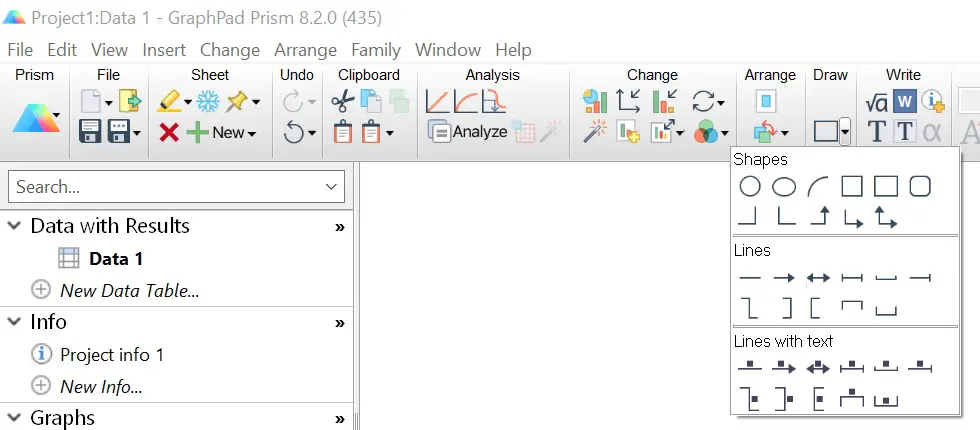
Select the option that suits your intention. For example, a horizontal line can be added to show the difference between multiple datasets. Or, use the zig-zag options when there are numerous datasets at different heights on the same graph.
Then, simply click and drag on the graph where you want the line to be. Prism will also ask what symbol to use above the line. You can either select from the options in the list or manually enter your own.
It is then possible to fine-tune the location and adjust either end of the line independently. Also, the snap feature will ensure the lines and symbols are directly above the dataset.
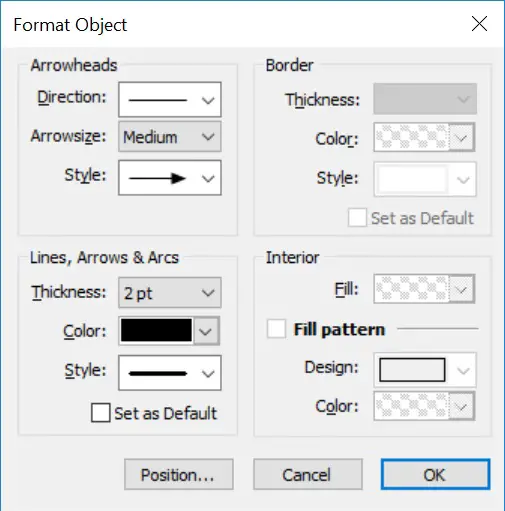
If you want to change the appearance of the line, such as the colour and thickness, then double-click on the line to open up the line settings.
How to add symbols without lines to graphs in Prism
If you just want to add a symbol onto the graph, instead of the accompying horizontal line, then simply use the text tool.
By using the text tool you can then enter any text or symbol you desire, such as *.
GraphPad Prism version used: 8.1.2