In this article, I will explain what is meant by a Ct value in quantification (real-time) PCR (qPCR). I will also discuss the difference between Ct and Cq values.
Mastering qPCR
A video tutorial explaining what a Ct value is in qPCR can be found in our Mastering qPCR course.
>>Use code 20QPCR to get 20% off<<
The amplification plot
To better understand the Ct value, it is worthwhile looking at the amplification plot of a qPCR run.
Whilst performing a qPCR experiment, the results are commonly displayed on an amplification plot. An example of a typical amplification plot, along with annotations, can be seen below.
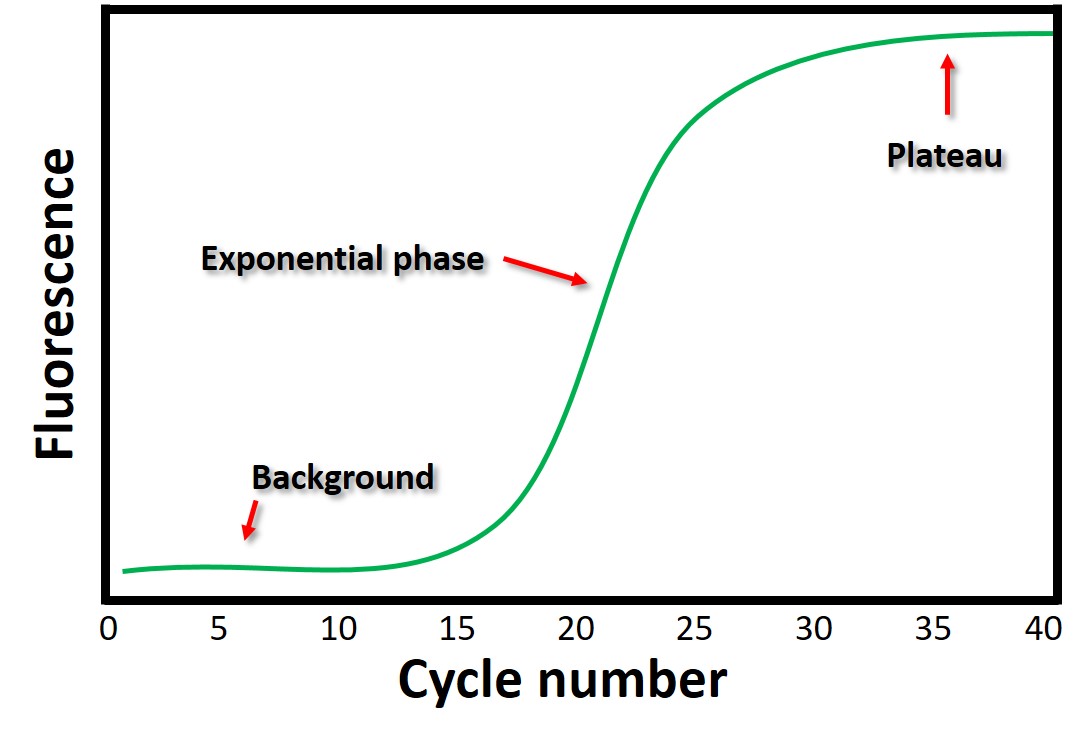
The plot resembles a sigmoidal amplification pattern, as indicated by the green line. This green line demonstrates the change in fluorescence over the number of cycles. Typically, in a qPCR experiment, there are 40 cycles. That is 40 rounds of amplification.
Background (or baseline)
At the start of the run, when the amount of PCR product is low, this produces very little fluorescence. This section of cycles (between cycles 0 and 15 in the above figure) is known as the background signal.
Exponential phase
Once the amount of PCR product is amplified enough, it will enter the exponential phase. This is when the amount of PCR product doubles for every PCR cycle. This can be seen in cycles 15 and 25 in the above amplification plot.
Plateau
Once all of the reagents, such as nucleotides, have been used up in the PCR reaction, the amplification will slow and ultimately plateau. This is the region where no more PCR products cannot be produced. This can be seen in cycles 30 and 40 in the above amplification plot.
What is the Ct value?
The cycle threshold (Ct) value of a reaction is defined as the cycle number when the fluorescence of a PCR product can be detected above the background signal. In order to calculate the Ct value, it is necessary to draw a horizontal line (threshold) on the amplification plot. The placement of this line is often determined by the qPCR software, however, users can manually place this line. Ideally, the threshold is placed at the point when the reaction is in the exponential phase, therefore it will not be confused with the background signal.
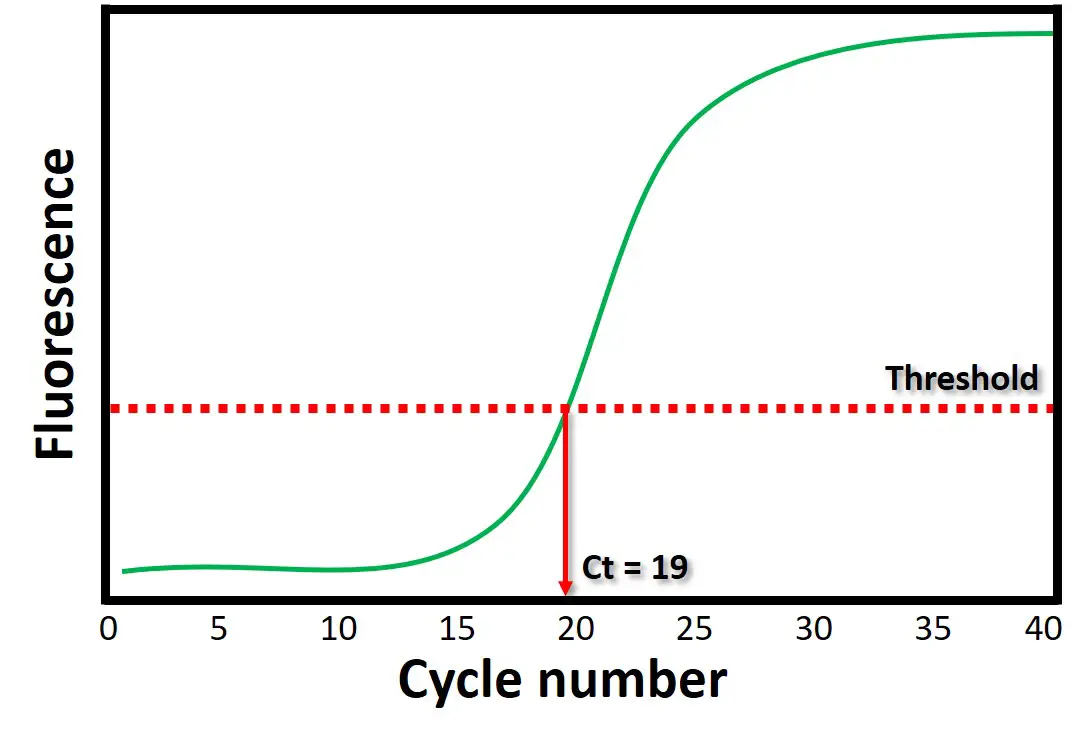
By looking at the example above, it can be seen that the cycle number when the threshold intersects the amplification plot is 19. Therefore, the Ct value will be 19 in this case.
The Ct value is associated with the amount of PCR product in the reaction. The lower the Ct value, the more PCR product that is present. This is because it takes fewer PCR cycles for that product to be detected over the background signal.
What is the difference between Ct and Cq values?
You will also often hear the term cycle quantification (Cq), maybe even crossing point (Cp) or take-off point (TOP). Basically, these terms all refer to the same value as the Ct value. Discrepancies in nomenclature have been historically inconsistent, with different qPCR manufacturers using different variations. The term Cq was proposed in the Minimum Information for Publication of Quantitative Real-TIme PCR Experiments (MIQE) Guidelines. Therefore, most people actually prefer the term Cq, as opposed to Ct.


Very Nice Illustration & Explanation / Casiker Vivekanand
Thanks for clarification of Ct value
Thank you Steven for a very nice article
thanks. When you write this article?
Thanks 🙂
It was March 14, 2018
nice and concise. Thanks
Hi , thanks for these nice information , but can you put references in your writings?
Your information is simple and valuable.
Hi steven,
I am a master student and This was really helpful. Thank you!!
Regards Axmee
Thanks Steven, I am just a starter and find your post really useful!
Hey Steven!
Wonderfully concise explanation my dude.
With cT and cQ being essentially the same thing, and them both referring to a cycle when fluorescence has increased significantly, could you explain what a cQ value would mean as a non integer?
like a cQ value of 9.32. would this indicate threshold was crossed during the 9th cycle?
Hi Connor,
Thanks for your comment 🙂
That is exactly correct. A CQ value of 9.32 would mean the fluorescence crossed the threshold at cycle number 9.32. The values are never integers, but the same concept applies. Since the cQ value is on the log scale, any subtle differences in value could translate to large differences in gene expression values.
I hope that makes sense?
Best wishes,
Steven
thanks Steven
Hi Ruth,
Many thanks for your message. I am glad you found it useful.
Best wishes,
Steven
Hi Steven, nice article! However, I find the second figure not quite correct. The threshold value should be set in the exponential phase as written quite correctly. In the figure however, this is clearly not done correctly, since the threshold line is set at the beginning of the exponential phase.
Best, Lorenz
Hi Lorenz,
Many thanks for your comment and the point about the figure. As you can see, I am not the best at drawing figures haha, I will amend this shortly :).
Best wishes,
Steven