In this post, I’m going to show you step-by-step how to manually calculate the standard deviation.
What is the standard deviation?
The standard deviation is basically used to show how spread out the data are, relative to the mean.
A low standard deviation indicates that the data are close to the mean, whereas a high standard deviation indicates that the data are spread further away from the mean.
Example data
For this example, let’s say I’ve measured the weight of 10 female bulldogs of a similar age. Below are their weights, measured in kilograms.
| Dog | Weight (kg) |
|---|---|
| 1 | 20.4 |
| 2 | 25.2 |
| 3 | 20.5 |
| 4 | 23.2 |
| 5 | 22.6 |
| 6 | 25.9 |
| 7 | 23.4 |
| 8 | 22.5 |
| 9 | 22.1 |
| 10 | 21.0 |
This randomly selected group of female bulldogs is known as a sample.
How to calculate the sample standard deviation
Step 1: Calculate the average
The first thing you need to do to calculate the standard deviation of the sample is to work out the average value.
To do this you simply add up all the values in your sample, and divide the answer by the number of values in the sample.
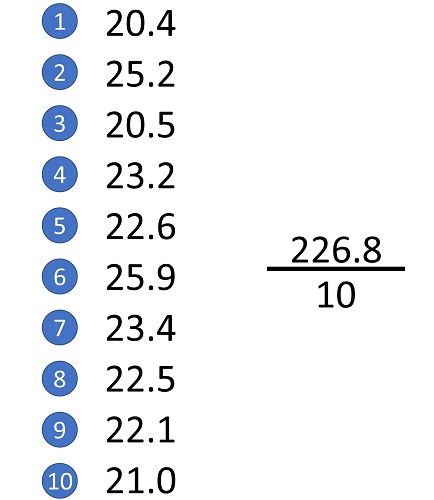
In my example, adding up all the values comes to 226.8 kg.
Then, since I have 10 individual dogs in my sample, I will divide this by 10 to give me an average weight of 22.7 kg.
Step 2: Calculate the difference between each value and the average
Now we have the average weight, the next step is to work out how far away these individual values are from the average value.
So, let’s take the first dog, which weighed 20.4 kg.
To work out the difference, simply do 20.4 – 22.7.
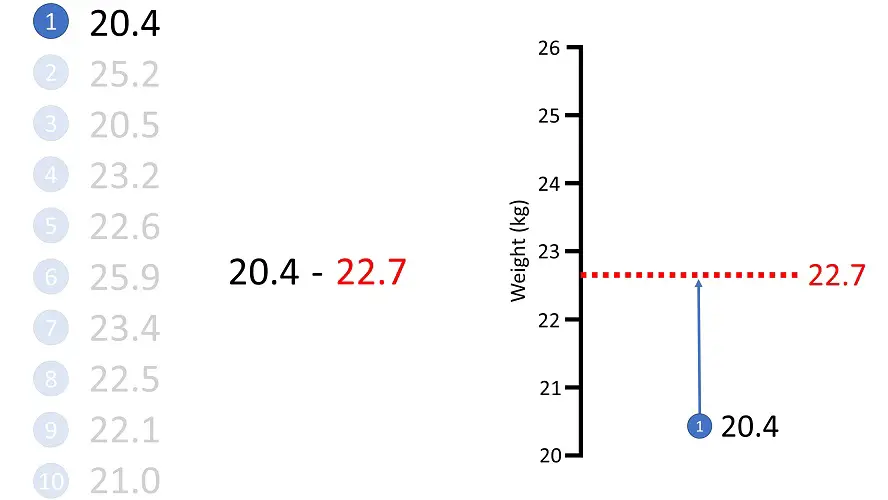
The answer is -2.3 kg.
For the next dog, the calculation will be 25.2 – 22.7, which comes to 2.5 kg.
And the process is then repeated for all values in the sample.
Step 3: Square these values
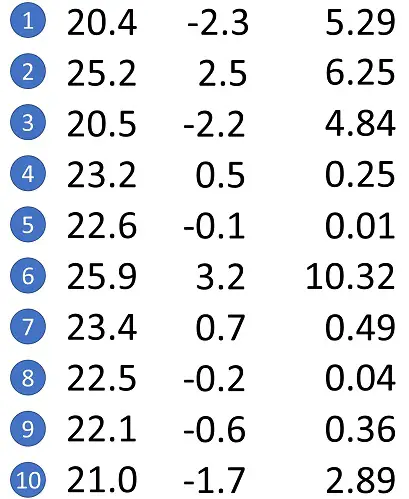
Once we have these values, the next step is to square each one.
So, for the first dog, this will be -2.3 kg squared.
This answer is 5.29 kg2.
The next dog will be 2.5 kg squared, which comes to 6.25 kg2.
And again, the process is repeated for all values.
Step 4: Add up these values
The next step is rather simple, we need to add up all these squared values we just calculated.
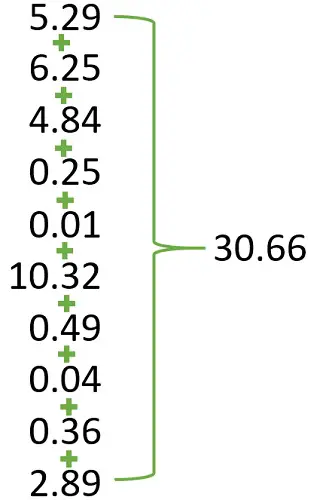
So, doing so for my example will give a value of 30.66 kg2.
Step 5: Divide by n – 1
The next step for calculating the standard deviation of a sample is to divide this value by what is known as n – 1.
In this case, n is the number of values in the sample, in other words, the number of dogs for my example.
Again, this is 10.
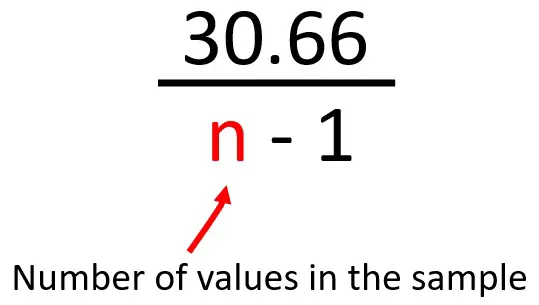
So, 10 – 1 = 9.
This means I need to do 30.66/9.
Doing so gives a value of 3.4 kg2.
This value right here is known as the variance.
Step 6: Square root the variance
To go from the variance to the standard deviation, you simply take the square root of the variance value.

So, for my example, this would be the square root of 3.4.
Doing so, gives a standard deviation of 1.8.
And since the standard deviation is expressed in the same units as the original measurements, I can say this is 1.8 kg.
So, for my sample, the average weight of the female bulldogs was 22.7 kg, with a standard deviation of 1.8 kg.
Usually, this is written as the mean value ± the standard deviation; in my example this would be 22.7 ± 1.8 kg.
Standard deviation formula
If you’re wondering what the complete equation is to calculate the standard deviation, as described above, then the below image shows the standard deviation formula for a sample and a population.
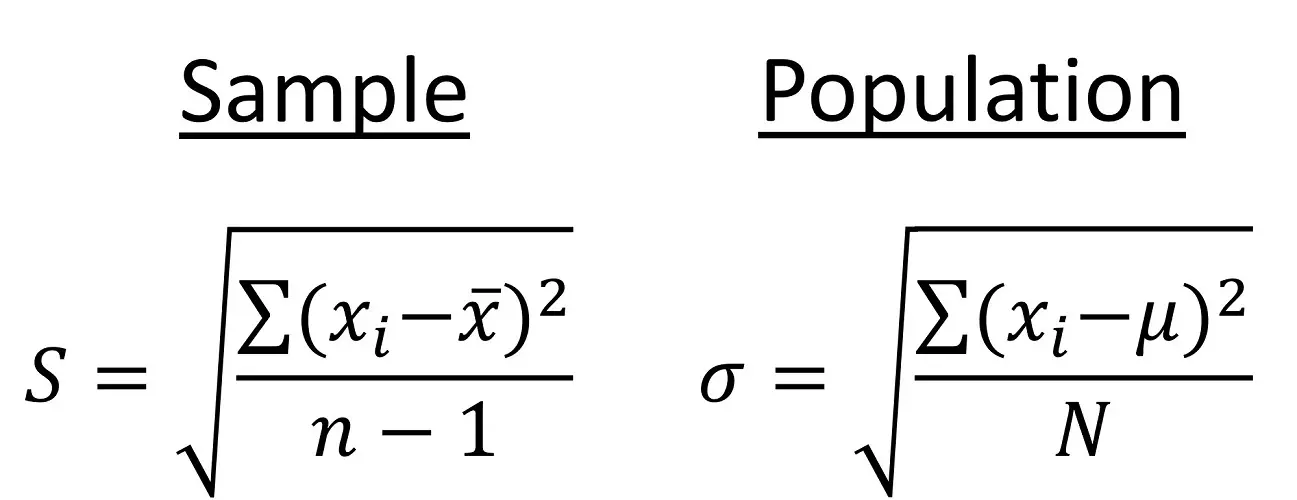
You’ll notice a slight difference between the two formulae; specifically, this is the denominator.
The standard deviation for a sample has n – 1, whereas the population formula has just N.
The n – 1 part in the sample calculation is known as Bessel’s correction.
It is simply used to correct for bias during the calculation, since the sample is just a randomly selected number of subjects from the overall population. When calculating the population standard deviation, no correction is required.
This is just something to keep in mind; however, most of the time, you will probably be only interested in calculating the standard deviation of the sample.
How to calculate the standard deviation: Final words
As you can see, when you break down the standard deviation formula, it’s actually quite straight forward!
You should now understand how to calculate the standard deviation of a sample and a population by hand.
Luckily, most statistical analysis software, including Microsoft Excel, has a function to do this for you.

