You have probably heard scientists quote p-values whenever they report the results from their experiment.
But, what is a p-value anyway?
In this article, I will clearly explain what a p-value is.
What is a p-value?
A p-value is an abbreviation of a probability value.
The p-value is a number that can be any value between 0 and 1.
But what exactly does this number represent?
The official definition of a p-value is quite difficult to understand:
A p-value is the probability of obtaining the observed difference (or a larger one) in the outcome measure, given that no difference exists between treatments in the population1
So, instead, the best way to explain what a p-value is, is to use an example.
An example
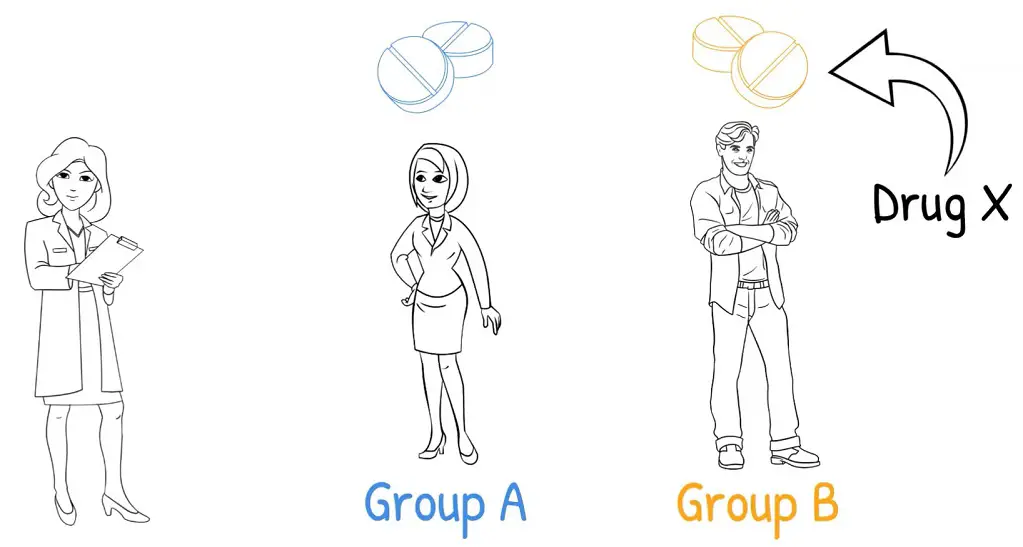
Let’s say you want to perform an experiment to see if a new type of weight loss drug (Drug X) causes people to lose body weight.
So, you randomly sample a collection of volunteers and randomly assign them into two groups: Group A and Group B.
You give Group A a placebo. In other words, this contains no active ingredients. Group A are therefore the control group. And, you give Group B the new drug (Drug X).
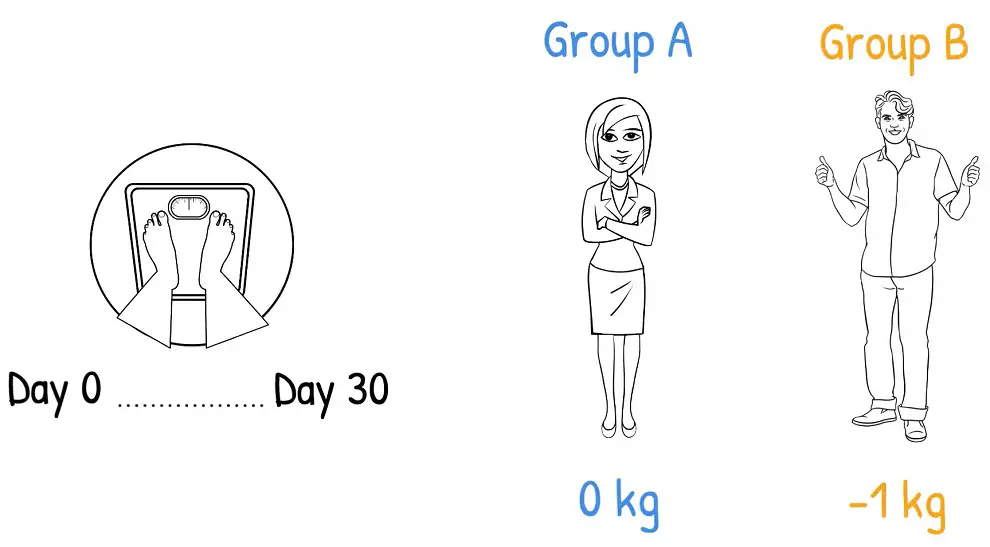
The participants are weighed at the start of the study and at the end of the study. This way, you can work out the body weight difference.
At the end of the study you work out that Group A’s average body weight difference was 0 kg, in other words, they did not gain or lose any body weight.
Group B’s weight difference was -1 kg, so on average they lost 1 kg of their body weight.
So, does this mean that the drug worked?
To determine this, we first ask ourselves:
What would happen in a world where the weight difference in volunteers who receive Drug X (Group B) is the same as the weight difference who received the placebo (Group A)?
This is where the null hypothesis comes in.
Introducing the null hypothesis
Usually, the null hypothesis states that there are no differences between groups, for example.
So, our null hypothesis is:
The weight difference in those who receive Drug X, is the same as the weight difference in those who receive the placebo
Now, we ask ourselves:
If this null hypothesis were true, what is the chance (or probability) of discovering a 1 kg reduction (or more) in body weight in those treated with Drug X from our sample?
This probability, or p-value, measures the strength of evidence against the null hypothesis.2
You can think of this as a court trial where the defendant is innocent until proven guilty; in this case, the defendant is the null hypothesis.
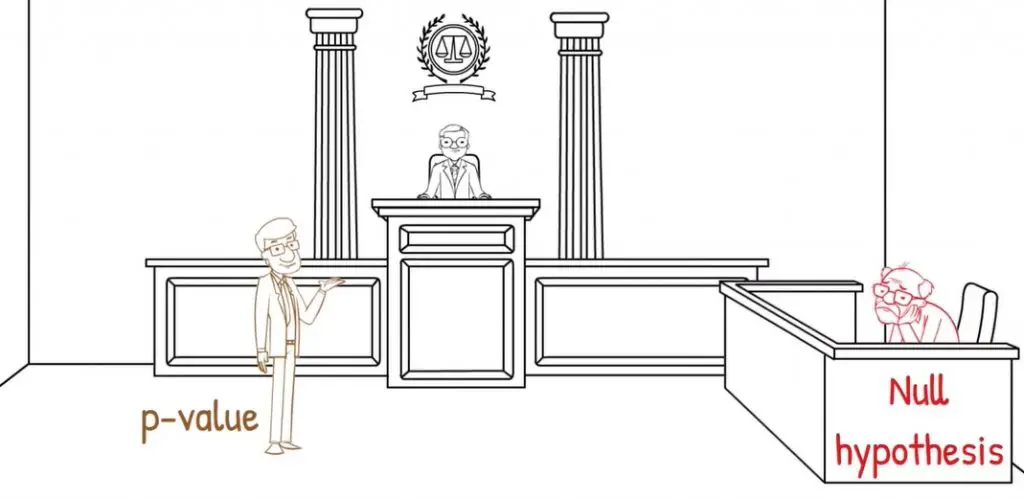
The smaller the p-value, the stronger the evidence against the null hypothesis.
Calculating a p-value
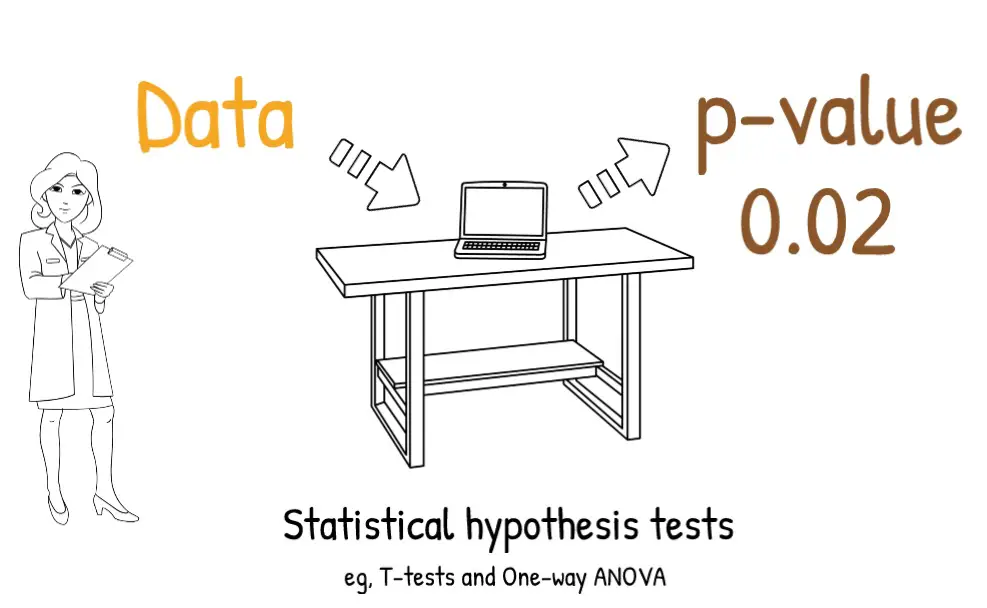
To determine the p-value, scientists use what are known as statistical hypothesis tests.
Common examples of statistical hypothesis tests include the Student T-test and a one-way ANOVA.
Since this is a top line overview, I will not bombard you with statistical jargon, but instead, pretend we have performed a statistical test using our data.
So, after inputting our experimental data into a statistical test, we get a p-value in return. Let’s say for our example, the p-value is 0.02.
It’s worth mentioning that the p-value is a fraction, however, it may be easier to convert this to a percentage to understand the concept better.
So, a value of 0.02, would be 2% (I simply multiplied the fraction by 100).
But what does this p-value result of 0.02 (or 2%) actually represent?
Interpreting a p-value
Essentially a p-value of 2% means that if the null hypothesis were true (that the two population means are identical), then there is a 2% chance of observing a difference as large (or larger) than what we observed in our sample.
In our example, this would translate to:
In a world where the weight difference in those who receive Drug X is the same as the weight difference in those who receive the placebo, then there is a 2% chance of observing a weight loss of 1 kg (or more) between our sample groups
To put that into perspective, a 2% chance corresponds to 1 in every 50 experiments of this size.
But, how can this be? What is accounting for this 2%?
Simply, this 2% can be accounted for by random noise.
Random noise
Let’s elaborate a little more on random noise.
There are quite a few things that can impact a p-value, and some of these factors are collectively known as random noise or random chance.
One type of factor that can contribute to random noise, especially in human studies, is the coincidence random sampling.3
For example, humans can exhibit a large amount of variation between one another due to genetic and environmental influences.
If we relate back to our example, some humans may contain an unknown gene that speeds up their metabolism and causes them to lose weight more than those without the gene.
When recruiting volunteers for our experiment, we did not perform any DNA analysis before randomly assigning the volunteers to either Group A, the control group, or Group B, the Drug X group; so, there was no way in knowing who was a carrier or not.
Imagine a situation where, just by pure coincidence, more volunteers with the high metabolism gene, are placed in Group B, than Group A; so, it makes sense that this group lost more weight.

So, here you can see that by a pure coincidence of random sampling, this can have a knock-on effect on the p-value.
Wrapping up
So, to sum up, a p-value refers to a probability value.
This p-value is a value between 0 and 1.
This number represents the probability of obtaining the observed difference (or a larger one) in the outcome measure of the sample, given that no difference exists between treatments in the population (the null-hypothesis is true).1
Random noise can affect the p-value. An example of random noise is the coincidence of random sampling.
References
- Sedgwick P. What is a p value? BMJ 2012;345:e7767. doi:10.1136/bmj.e7767
- O’Brien SF, Osmond L, Yi Q-L. How do I interpret a P value? Transfusion 2015;55:2778–2782. doi:10.1111/trf.13383
- Motulsky H. Intuitive biostatistics: a nonmathematical guide to statistical thinking, 4th edn. 2017. Oxford University Press, Oxford. Link
")

Well explained . thanks
Your tips and video are great.
Thank you so much.