In this article, I’m going to clearly answer the question: what is Pearson correlation?
I will not be covering the detailed maths involved in the test, but instead provide a gentle introduction as to what a Pearson correlation test is.
I will also discuss the Pearson correlation test assumptions.
What is Pearson correlation?
Suppose I have measured two continuous variables, weight and height, in 10 different people.
If I plot the data on a scatter graph, so that the weight data is on the X-axis and the height data is on the Y-axis, it will look something like this.
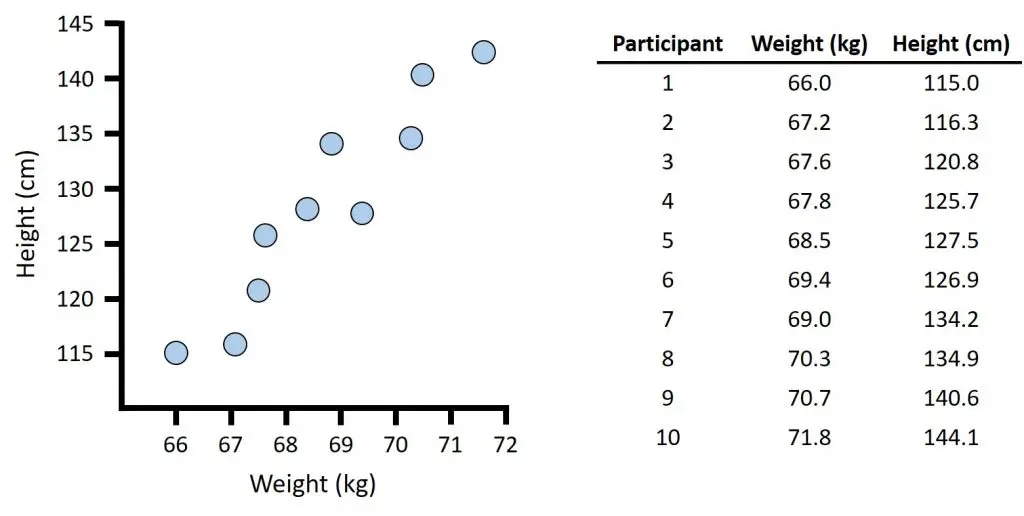
Each point on the graph represents a single person’s paired measurement of weight and height.
Note, for the purpose of a Pearson correlation test, it does not matter which variable is plotted on the X-axis and which is on the Y-axis. Also, the variables do not need to be measured using the same scale.
As you can see in this example, I have weight measured in kg and height measured in cm.
You can clearly see that the values of weight vary between different participants; similarly, the values of height also vary between different participants.
And, as shown in the scatter graph, the two variables tend to vary together; that is, as the value of weight increases, so does the value for height, and they do so in a linear fashion.
Note, the linear pattern is important here.
If I plot a line of best fit through the data, you can see this relationship easier to see.
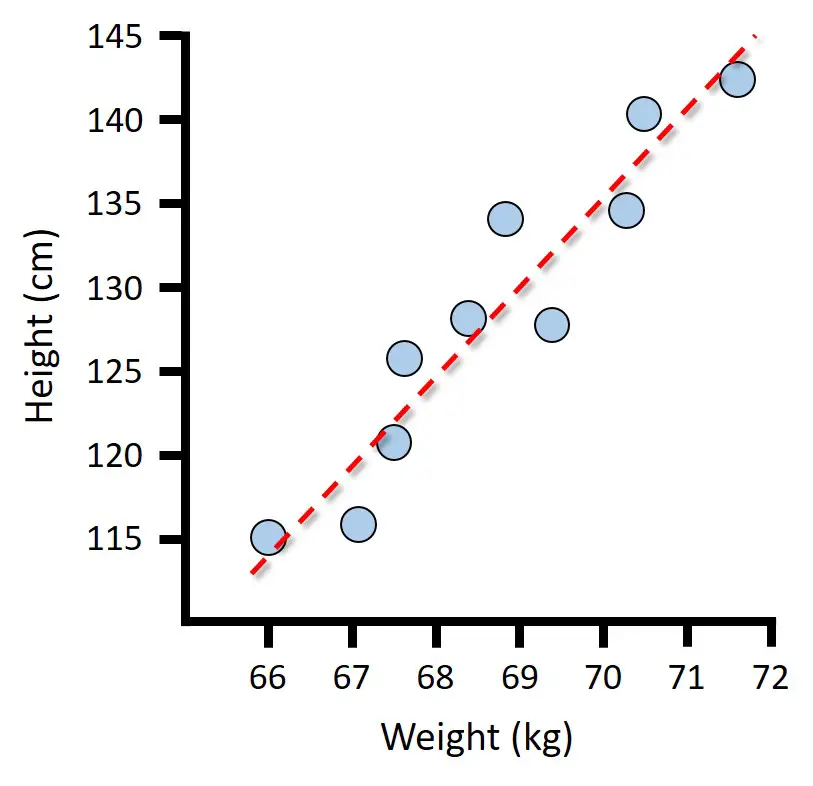
This relationship between variables in statistics is known as correlation.
A Pearson correlation test is used to measure the strength and direction of this linear correlation.1
Outputs from the Pearson correlation test
Suppose I have performed a Pearson correlation test using my example data.
I get three outputs in return:
- Pearson correlation coefficient (r)
- Coefficient of determination (R2)
- p-value
Pearson correlation coefficient
The Pearson correlation coefficient, abbreviated as r, is the test statistic.
Note, r is usually written in lower case in the literature, not upper case.
This single value can tell us two important factors about the correlation:
- Direction
- Strength/magnitude
So, in this example, the correlation coefficient is 0.9557; but what does this mean?
The correlation coefficient value can be any number between –1 and +1; and it has no units on measure.
To understand the direction of the linear correlation, you simply look at whether the coefficient value is negative or positive.
A positive correlation coefficient value indicates a positive correlation between the two variables; this can be seen in this example, since our r is a positive number.
On the other hand, a negative correlation coefficient value indicates a negative correlation between the two variables; so, as Variable X increases, Variable Y decreases or vice versa.
The absolute value of the correlation coefficient indicates how strong the two variables correlate in a linear fashion.
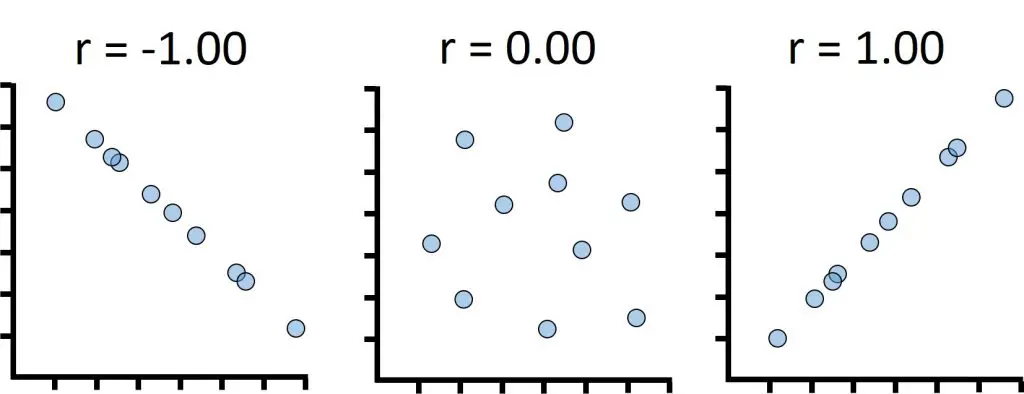
Correlations range between:
- Perfectly positive correlation: r=1
- Perfectly negative correlation: r=-1
- No correlation: r=0
There have also been some attempts to apply certain cut-offs to the absolute correlation coefficients to precisely describe the magnitude of the correlation.1
| Correlation coefficient (r) | Interpretation |
| 0.00–0.10 | No correlation |
| 0.10–0.39 | Weak correlation |
| 0.40–0.69 | Moderate correlation |
| 0.70–0.89 | Strong correlation |
| 0.90–1.00 | Very strong correlation |
It is very important to understand that these are broad cut-offs that do not take into account the scientific question.
You should always interpret a correlation coefficient in the context of the experiment in question.
For example, a correlation coefficient of 0.2 may indicate a weak correlation in some scientific disciplines, but it actually may be a rather large correlation in other areas of science.
Coefficient of determination
The coefficient of determination (R2) indicates the amount of variance shared between the two variables.
As the name suggests, R2 is computed by squaring the correlation coefficient value.
So, if you don’t have R2 from the output of your Pearson correlation test, simply square the correlation coefficient.
R2 is an absolute value that is always between 0 and 1.
In my example, the R2 is 0.9133.
To interpret the coefficient of determination better, it is more convenient to multiply it by 100 to convert it to a percentage.
So, an R2 of 0.9133 is the same as 91.33%.
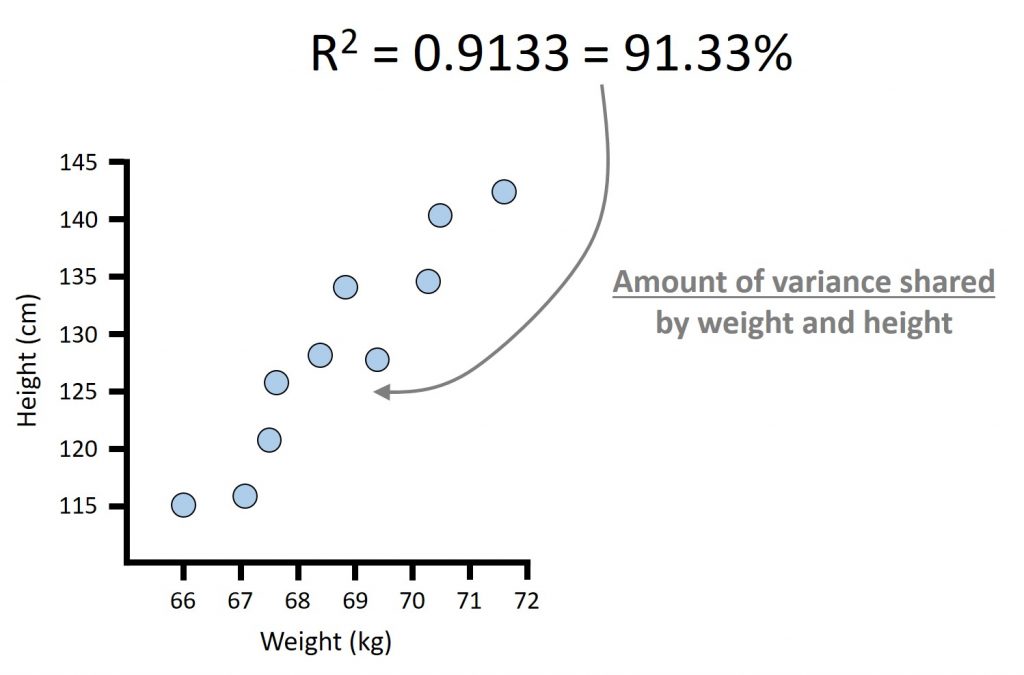
But what does this mean?
We can say that 91.33% of the variability in weight is explained by the variability in height.
And, since it does not matter which way around the variables go on the axes, this means that the reverse is also true; 91.33% of the variability in height is explained by the variability in weight.
The other 8.67% of the variance is explained by other factors that were not measured in the experiment, such as measurement errors.
p-value
The third main output from a Pearson correlation test is obviously the p-value.
Usually, when performing the test, a two-tailed analysis is performed.
In this case, the null hypothesis is:
- There is no correlation between weight and height in the overall population.
In other words, the Pearson correlation coefficient is 0.
And the alternative hypothesis is:
- There is a correlation between weight and height in the overall population
So, the Pearson correlation does not equal (≠) 0.
In my example, the p-value is so small that it is quoted as <0.001.
So, if my alpha level (significance threshold) was set at 0.05, we reject the null hypothesis and conclude that there is a correlation between weight and height.
Note, we did not state the direction (either positive or negative) for the correlation in our hypotheses. If we stated a direction in the null hypothesis, then we would perform a one-tailed analysis.
Assumptions of Pearson correlation test
So, now you know what a Pearson correlation test is, let’s now move on to discussing what the assumptions of the test are.
To be able to perform a Pearson correlation test and interpret the results, the data must satisfy all of the following assumptions.
If one assumption is not met, then you cannot perform a Pearson correlation test and interpret the results correctly; but, it may be possible to perform a different correlation test.
1. Your sample is random
The sample that is used for your experiment should contain a truly random sample that is representative of one population of interest.1,2

How to test
Of course, this is determined by your experimental set-up.
For example, when recruiting participants, were the participants randomly recruited for the study? If so, then you are good to go.
2. Both variables are continuous data
Both Variable X and Variable Y involved in the test should be measured on a continuous scale (i.e. on an interval or ratio level).1,2
How to test
Simply look at your two variables of interest and see what their units are. Are the variables measured on an internal or ratio scale?
Examples of interval measurements include temperature and pH.
Examples of ratio measurements include weight, length and concentration.
If so, then great!
If the data isn’t measured on a continuous scale, for example if it is ordinal data (such as disease severity or performance grouping), then you may want to look at alternative correlation method such as a Spearman correlation test.
3. Data contains paired samples
To perform the test, each subject much have both Variable X and Variable Y values.2
How to test?
Depending on how large your dataset is, you can simply visually inspect the data.
Or, you can use a statistical program to run some simple descriptive statistics.
If there are missing data, such as one participant did not have data for one variable, then that entry is usually removed by the statistical program before the Pearson correlation test is performed.
So, don’t worry too much if you have missing values, but remember that your N number involved in the analysis will be reduced.
4. Independence of observations
There should be no relationship between the values of variables between subjects.1,2
Each observation of Variable X should be independent of other observations of X and each observation of Variable Y should be independent of other observations of Y.
How to test?
This should be known based on your experimental design.
For example, are any subjects recruited in the study related? If so, this would violate the independence of observations assumption.
Or, were multiple measurements taken from the same subject and entered as separate entries? Again, this would violate the independence of observations.
5. Variables are approximately sampled from a normal (Gaussian) distribution
Both Variables X and Y must be sampled from a population that exhibits an approximate normal distribution.1,2
How to test?
The two main methods to check data for normality is to:
- Inspect your data on visual plots, such as Q-Q plots and frequency distributions
- Perform normality statistical tests
If one or both of your variables are not sampled from a normal distribution, then the Pearson correlation p-value cannot be correctly interpreted.
If this is assumption is violated, then you can try transforming your data to improve the distribution.
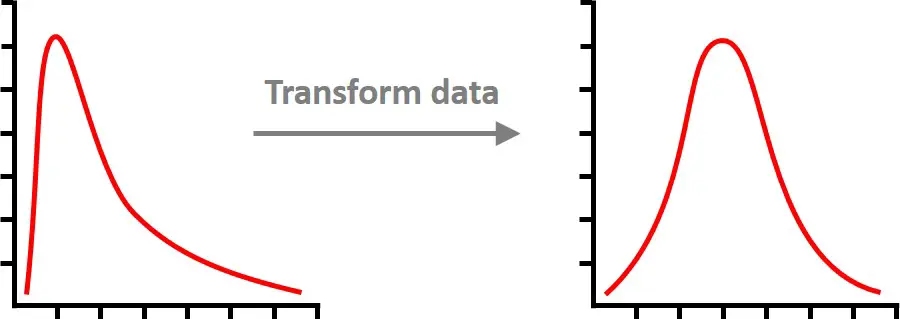
Or, you may want to perform correlation tests that do not assume normality of data, for example a Spearman correlation test.
6. A linear association exists between the variables
This may seem counter-intuitive, but this assumption is often over looked when performing a Pearson correlation test; the two variables must exhibit a linear correlation before you actually run the test.1,2
Remember, the aim of a Pearson correlation test is to measure the magnitude of the linear relationship between two variables; not to simply see if a correlation exists.
How to test?
The best, and most simple, way to test this is to plot the two variables on a scatter plot and visually inspect it.
If no linear association exists, then do not perform a Pearson correlation test; pure and simple.
When inspecting the scatter plot, a non-linear relationship may exist; if so, you can measure the magnitude on non-linear monotonic relationships with a Spearman correlation test.
7. Absence of outliers
There should be no outliers present in your data.1,2
How to test?
As with the previous assumption, the best way to test for outliers is to plot a scatter plot.
Outliers can heavily influence the outcome of a Pearson correlation test.
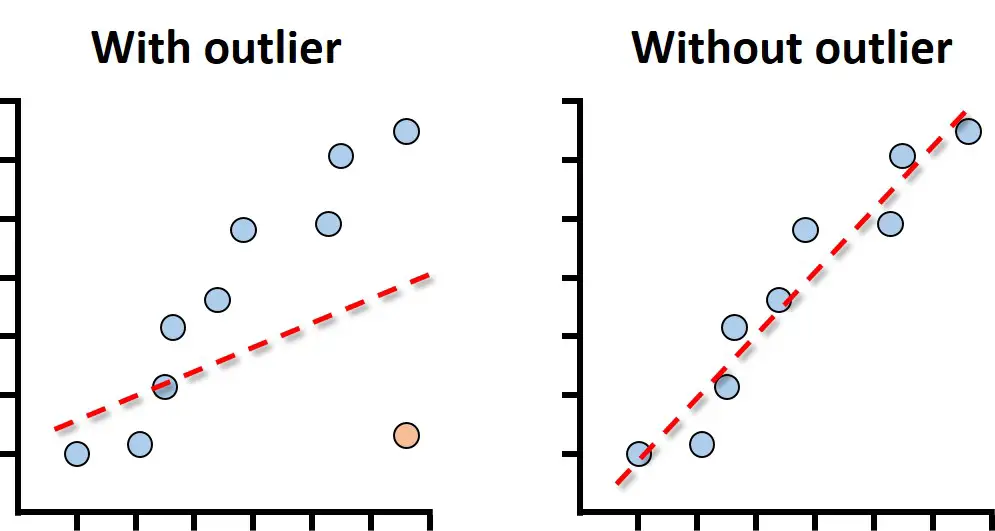
If you have outliers in your data, you will have to think carefully about your next steps; either remove them with justification or run a correlation test that is less sensitive to outliers, such as a Spearman rank test.3
Wrapping up
So, to sum up, a Pearson correlation test measures how the direction and how strong a linear correlation is between two variables.
The result is a single value known as the Pearson correlation coefficient, or r value.
A positive r value indicates that as one variable increases, so does the other; a negative r value indicates that as one variable increases, the other decreases.
If you square the r value, you get the coefficient of determination, or R2. R2 indicates the amount of variance shared between the two variables.
A p-value from a Pearson correlation test is used in hypothesis testing to determine if the correlation between the two variables is statistically significant.
There are many assumptions of a Pearson correlation test; all of these need to be satisfied before you perform the test; these are:
- The sample is random
- Both variables are continuous data
- Data contains paired samples
- Independence of observations
- The variables are approximately normally distributed
- A linear association exists between the two variables
- There are no outliers in your data
References
- Schober P, Boer C, Schwarte LA. Correlation coefficients: appropriate use and interpretation. Anesth Analg 2018;126:1763–1768. doi:10.1213/ANE.0000000000002864
- Motulsky H. Intuitive biostatistics: a nonmathematical guide to statistical thinking, 4th edn. 2017. Oxford University Press, Oxford. Link
- de Winter JC, Gosling SD, Potter J. Comparing the Pearson and Spearman correlation coefficients across distributions and sample sizes: A tutorial using simulations and empirical data. Psychol Methods 2016;21:273–290. doi:10.1037/met0000079
")

This is the clearest explanation of the Pearson correlation, (along with its assumptions, how to know if your data meets those assumptions, and what to do if your data doesn’t meet those assumptions) that I have EVER read. This is PERFECT to share with my Master’s students. THANK YOU!
I appreciate Dr. Steven Bradburn to publish the fluent description of STAT.
Thank you 🙂