In this guide, I will explain how to perform a One-Way ANOVA test in GraphPad Prism. I will also show you how to interpret and report the results.
Assumptions of a One-Way ANOVA test
Before running a One-Way ANOVA test in GraphPad Prism, it is best to ensure the data meets the following assumptions.
- The dependent variables should be measured on a continuous scale (either interval or ratio).
- There should be three or more independent (non-related) groups.
- There are no outliers present in the dependent variable.
- The dependent variables should be normally distributed. See how to test for normality in GraphPad Prism.
- The dependent variables should have homogeneity of variances. In other words, their standard deviations need to be approximately the same.
Setting up the GraphPad sheet
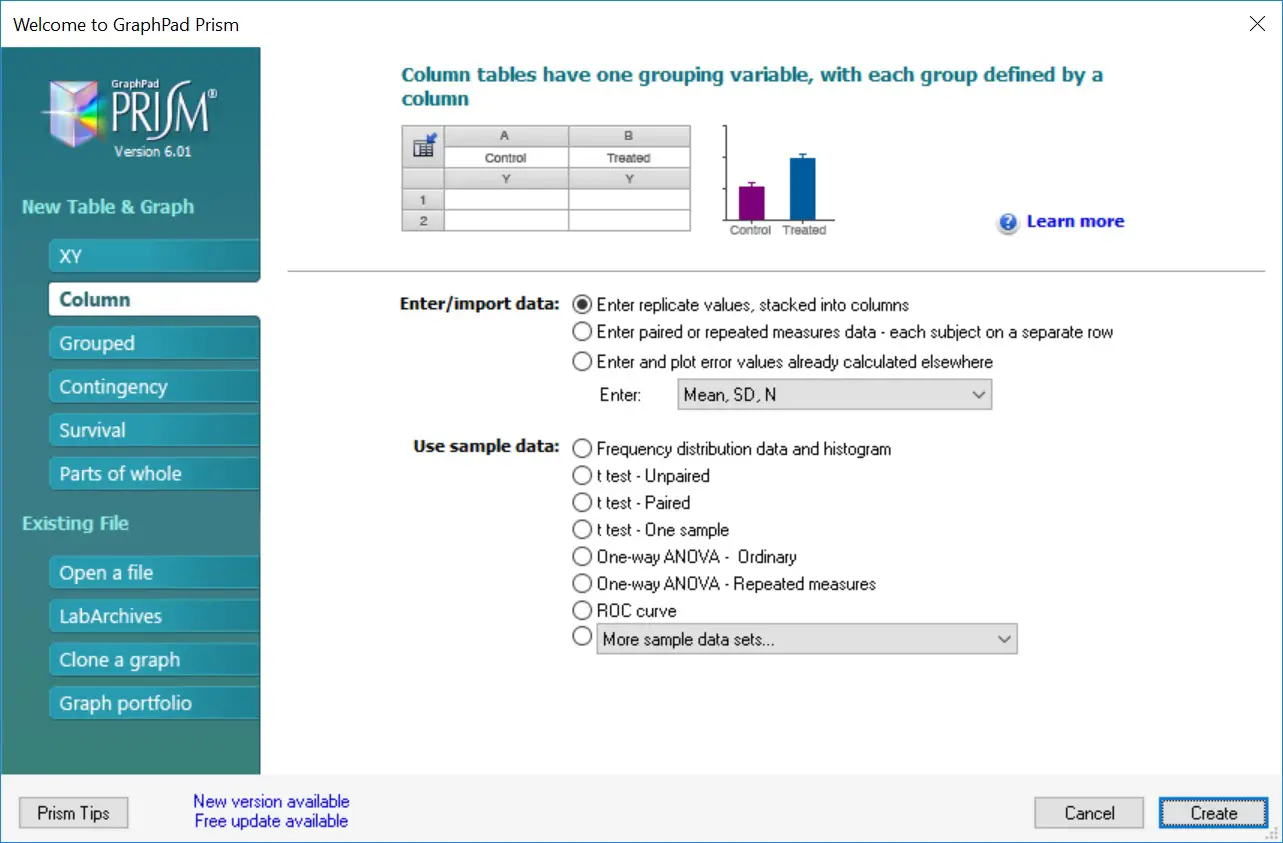
To perform a One-Way ANOVA test in GraphPad Prism you will need to enter groups of data into separate columns. Upon opening GraphPad Prism, select the ‘Column’ type for the ‘New Table & Graph’ option. Then select ‘Enter replicate values, stacked into columns’ as the ‘Enter/import data’ choice.
Alternatively, you can go to ‘File > New > New Data Table & Graph …’.
Example dataset
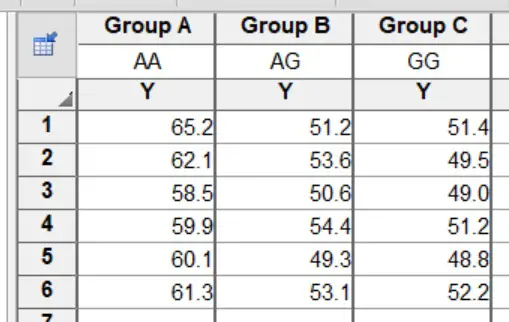
I will use a theoretical example of comparing the age at which three groups of individuals encountered a certain disease (disease X). The groups are stratified by their genotype (AA, AG, GG) for a certain gene. In total, I have 6 data points for each group. Each group’s data is separated into different columns.
The null hypothesis for this example will be:
“There is no difference in the age of disease X contraction between the three genotypes”.
And the alternative hypothesis will be:
“There is a difference in the age of disease X contraction between the three genotypes”.
Performing the test
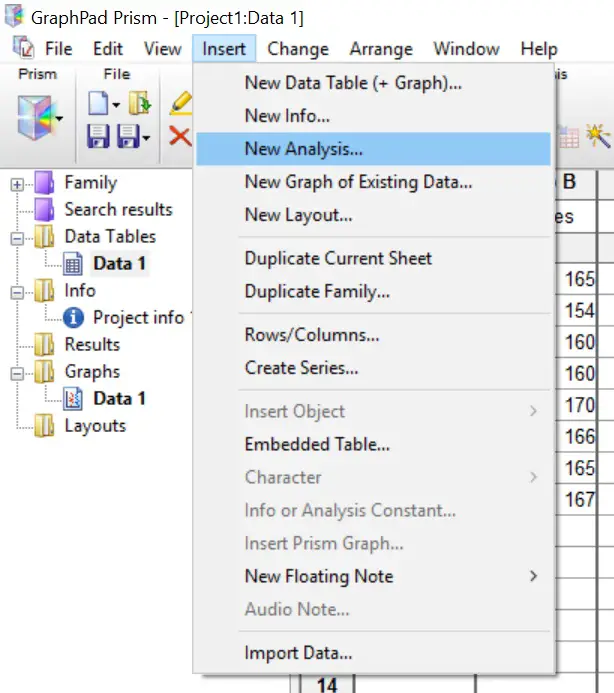
- To perform a One-Way ANOVA test in GraphPad Prism, first, go to ‘Insert > New Analysis …’.
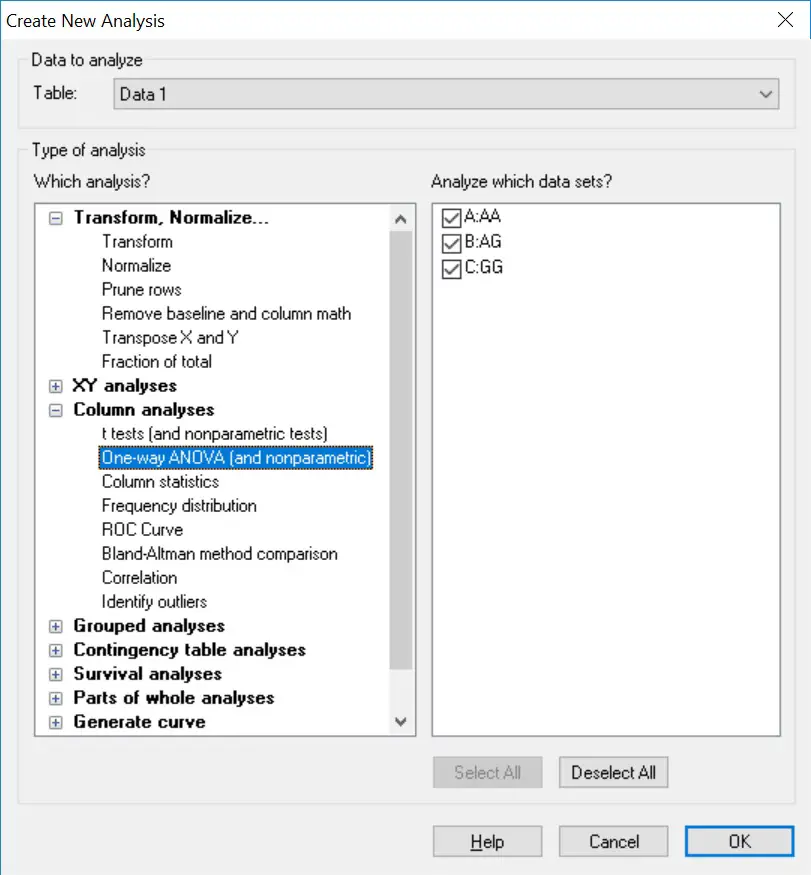
2. This will open a new window. Here you need to tell GraphPad which test to perform. Select the ‘One-way ANOVA (and nonparametric)’ analysis under the ‘Column analyses‘ section. Double check that the datasets are ticked on the right window to be included in the test. Click the ‘OK’ button.
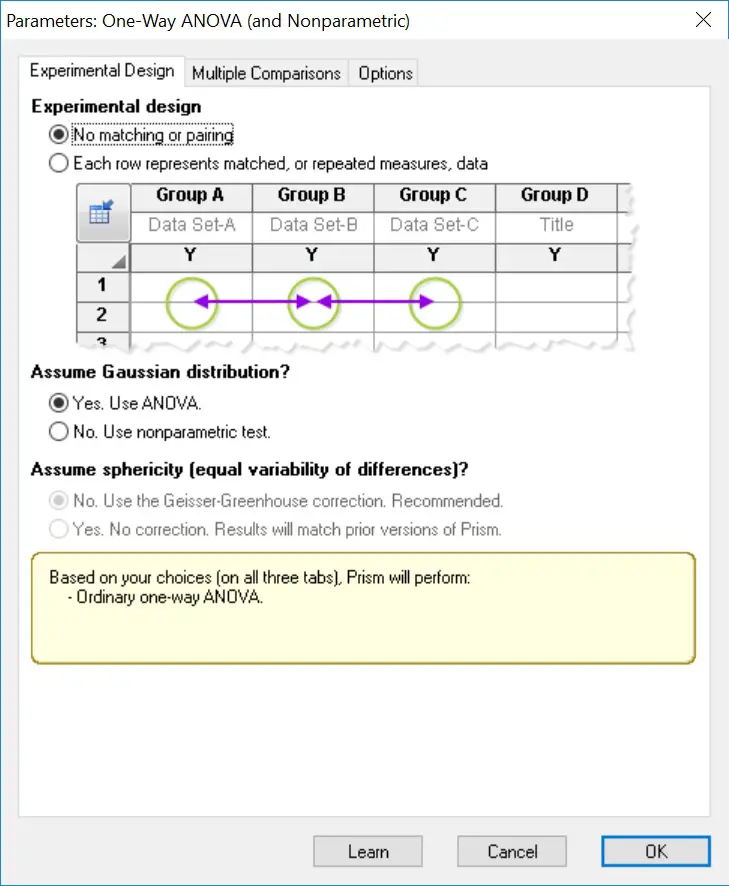
3. The next window will ask you to specify which test to perform. In this case, select the ‘No matching or pairing’ option, under the ‘Experimental design‘ header. Next, select ‘Yes. Use ANOVA’ under the ‘Assume Gaussian distribution’ header below.
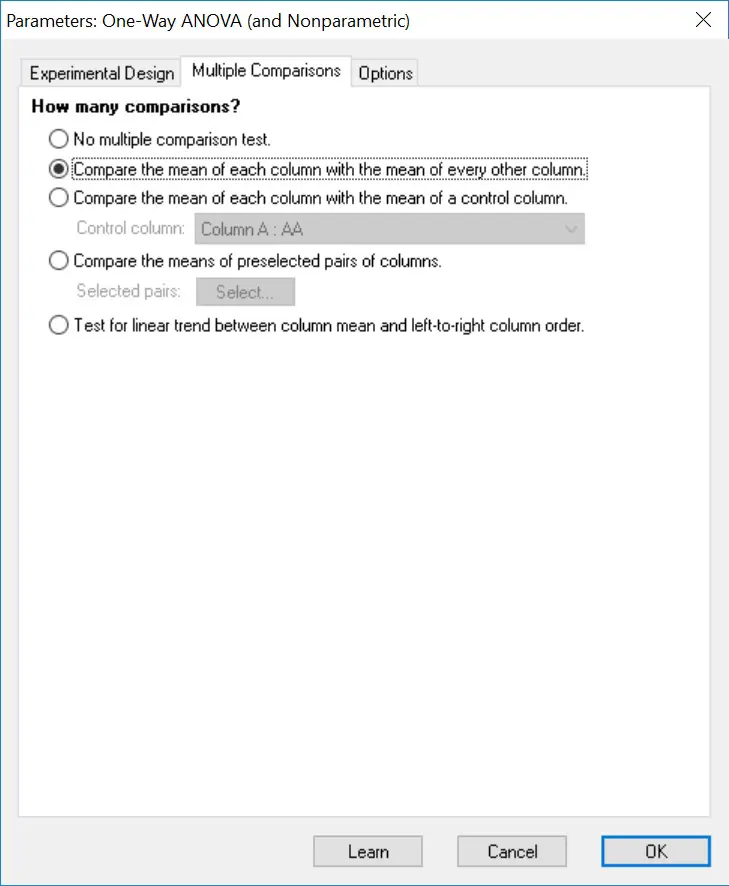
4. Next, click the ‘Multiple comparisons‘ tab at the top. Select the ‘Compare the mean of each column with the mean of every other column‘ option. This will enable post-hoc testing to be carried out to determine where, if any, the significance lies.
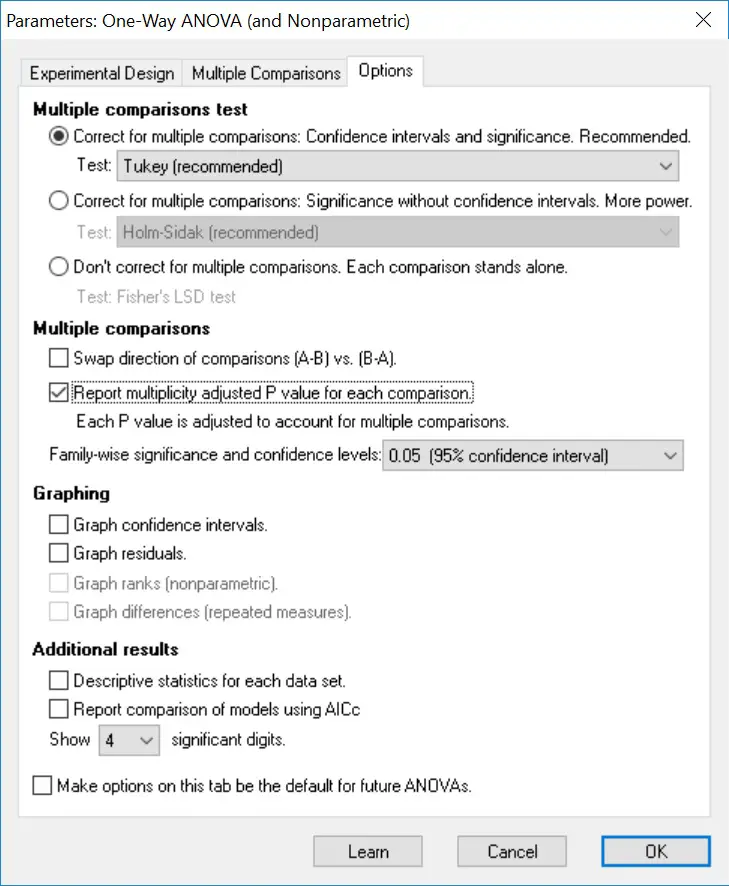
 5. Finally, click the ‘Options‘ tab at the top of the window. Ensure the ‘Correct for multiple comparisons: Confidence intervals and significance. Recommended.‘ option is selected, found under the ‘Multiple comparisons test‘ header. Then, select the appropriate post-hoc method to use. Tukey testing is selected as default, as is recommended by GraphPad, however, there is also the option to run Bonferonni and Sidak methods.
Also, I recommend selecting the ‘Report multiplicity adjusted P value for each comparison‘ option, under the ‘Multiple comparisons‘ header. The P values presented will then be adjusted.
Finally, click the ‘OK‘ button to run the One-Way ANOVA test.
Output (ANOVA)
The results are split into two sheets: ‘ANOVA‘ and ‘Multiple comparisons‘. Click on the first sheet to see the results of the overall ANOVA test.
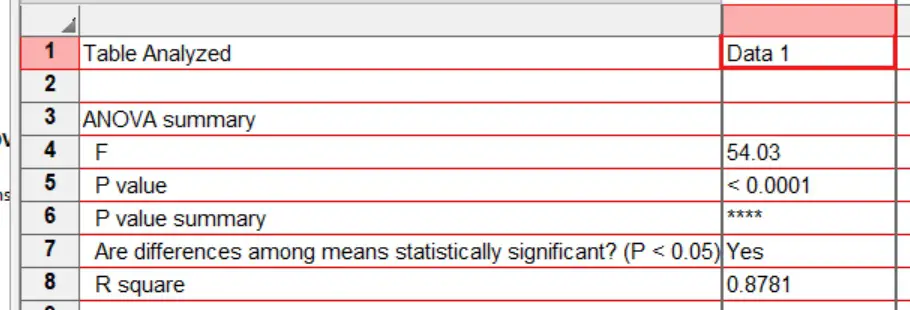
Focus on the output under the ‘ANOVA summary‘ header. Each output is as follows:
- F – The F statistic.
- P value – The P value of the One-Way ANOVA test.
- P value summary – A summary of the p-value as represented by asterisks. These are useful to signify the level of significance on graphs, for example.
- Are differences amoung means statistically significant? (P<0.05) – A straight yes or no answer to was there any significance.
- R square – The R square value.
There are also other outputs reported in this sheet underneath, such as the F tests (Brown-Forsythe and Barlett’s).
Interpretation (ANOVA)
By looking at the ‘Significantly different? (P<0.05)’ output, a ‘Yes’ is given which means that the results are significantly different from each other. The exact P value is given next to ‘P value’. In this case, a P value of <0.0001 is a very significant result.
Therefore, we accept the alternate hypothesis and reject the null hypothesis.
However, it is not known what groups explain the significance, simply that there is a difference between the three groups. This is where you now look at the results of the post-hoc tests.
Output (post-hoc)
Next, open the results of the post-hoc tests by clicking the ‘Multiple comparisons’ results sheet.
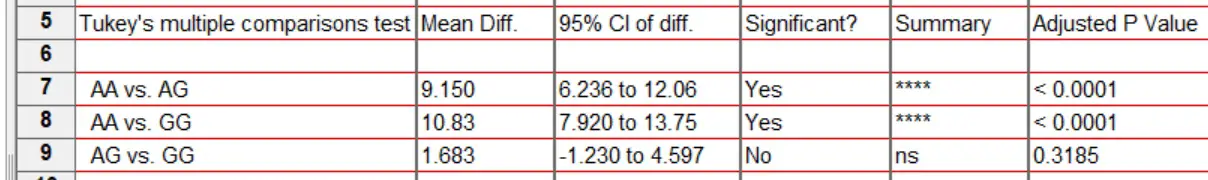 Focus on the output under the ‘Tukey’s multiple comparisons test‘ header. Each group comparison is listed in a separate row. Since we have three groups, there are three possible comparisons. The results presented are as follows:
- Mean Diff. – The difference between the two means.
- 95% CI of diff. – The 95% confidence intervals for the difference.
- Significant? – A Yes or No answer as to whether the comparison is significance, i.e P < 0.05.
- Summary – The summary of the significance presented as asterisks.
- Adjusted P Value – The adjusted P value for the comparison.
The other useful output to look at is the ‘Test details‘ table which reports the descriptive statistics for each comparison, such as the mean and n number of each group.
Interpretation (post-hoc)
By looking at the three comparisons, and focussing on the ‘Significant?‘ and ‘Adjusted P Value‘ columns, there are two significant results. Specifically, the comparison between groups AA vs AG and AA vs GG were significant. There was no difference between the AG vs GG groups.
Reporting
To report the results of a One-Way ANOVA, it is appropriate to state the overall ANOVA test result first, followed by any post-hoc tests performed. An example of the reporting can be seen below.
 The degrees of freedom (Df) can be found in the Brown-Forsythe test results table.
GraphPad Prism version used: 6


