In this tutorial, I will show you how to calculate the odds ratio (OR) and 95% confidence intervals (CIs) in Microsoft Excel.
Example data
To start with, let me introduce you to my example data.
Let’s say I performed a case-control study to determine the association between a specific gene variant, known as G1, with a disease, known as Disease X
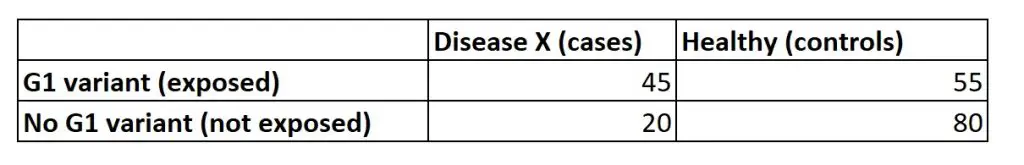
In the study, there were 45 people with Disease X that had the G1 gene variant and 55 without Disease X that had the G1 gene variant.
On the other hand, there were only 20 people with Disease X that did not have the G1 gene variant, compared with 80 people without Disease X.
Odds ratio formula
So, how do we go about calculating the odds ratio?
If I assign letters to each cell in the grid and I can then reveal the odds ratio formula.
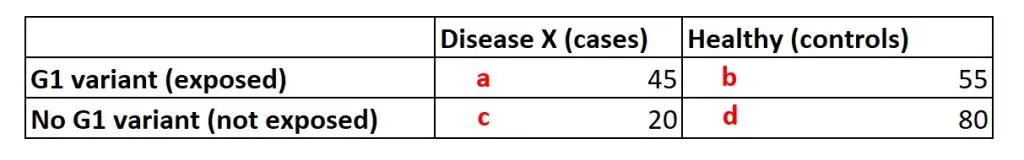
Let’s now take a look at the odds ratio formula.

This is quite easy to understand.
Firstly, we must divide a by c.
Then, we separately divide b by d.
Finally, we divide the first answer, by the second answer, which gives us the odds ratio.
How to calculate odds ratio in Excel
Firstly, calculate the odds of the exposure in the case and the control groups.
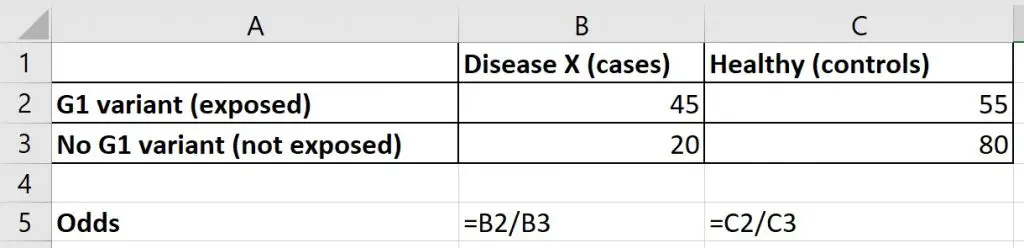
For my example data, the odds of carrying the G1 variant among those with Disease X was 2.25 (45/20).
And, the odds of carrying the G1 variant among those without Disease X was 0.69 (55/80).
Finally, to calculate the odds ratio, divide the first odds by the second odds.
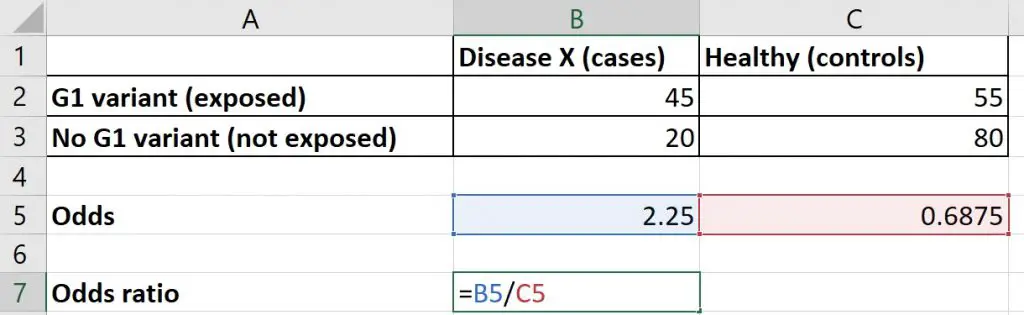
So, the odds ratio for this example was 3.27 (2.25/0.6875).
But, what does this mean?
In this case, we can say that the odds of carrying the G1 gene variant were 3.27 times higher among those with Disease X, compared with those without Disease X.
So, now you know how to calculate the odds ratio, how do you go about calculating the 95% confidence intervals for the odds ratio?
95% confidence interval for the odds ratio formula
The confidence interval gives an expected range for the true odds ratio for the population to fall within.
The equation to do calculate the 95% confidence intervals for the odds ratio is as follows.

Where Ln refers to the natural log.
How to calculate the 95% confidence intervals in Excel
To start with, calculate the natural log (ln) of the odds ratio.
To do this in Excel, simply use the following formula.
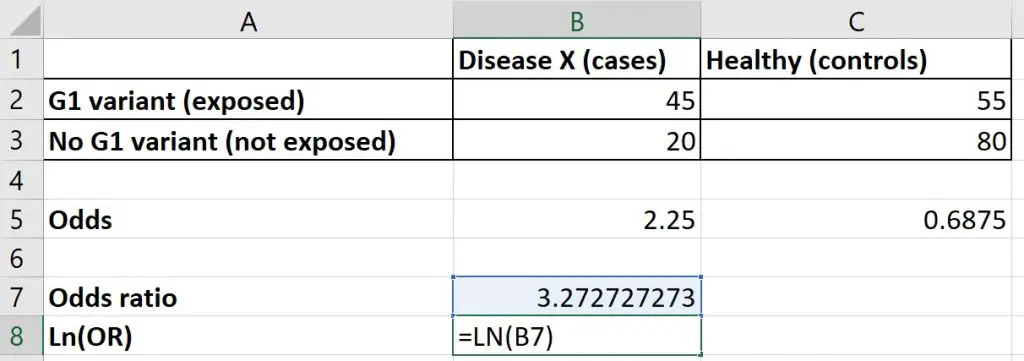
In my example, the natural log of the odds ratio was 1.186.
Now, to calculate the upper and lower 95% confidence intervals for the odds ratio, use the following formula.
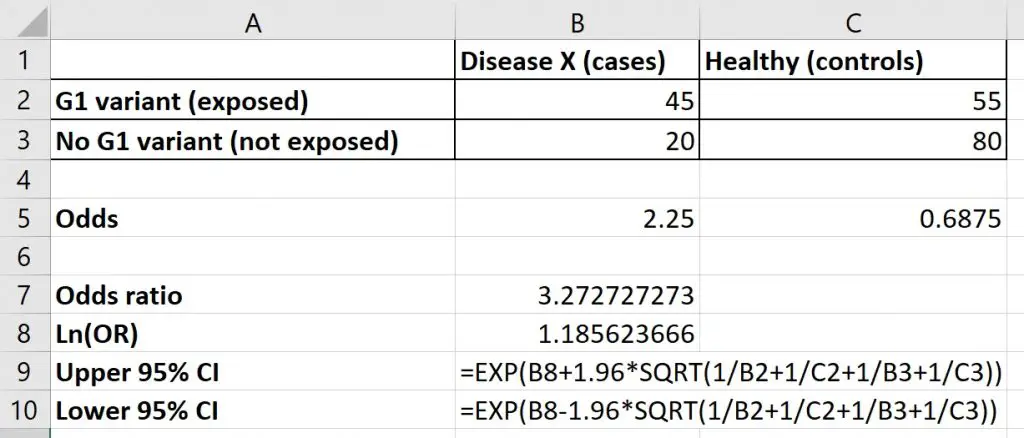
The 95% confidence intervals in my example were 1.75 and 6.14.
So, taken together, I can say that the odds of carrying the G1 gene variant were higher among those with Disease X, compared with those without Disease X (OR = 3.27, 95% CI = 1.75, 6.14).
Wrapping up
In this tutorial, I have shown you how to calculate the odds ratio in Microsoft Excel. I have also demonstrated how to calculate the 95% confidence intervals for the odds ratio.
Microsoft Excel version used: 365 ProPlus

")

am grateful to your software help and really supported me with exercise that has been illustrated