In this video tutorial, I’m going to show you how to perform a one-way analysis of variance (one-way ANOVA) test by using Microsoft Excel.
I’ll start by showing you how to perform the test, and then I will describe the results of the test.
Example data
For this example, I have data from 3 different male groups for their performance on the vertical jump test.
Each different group is in a different column and each cell represents a different participant’s height that they jumped (in cm).
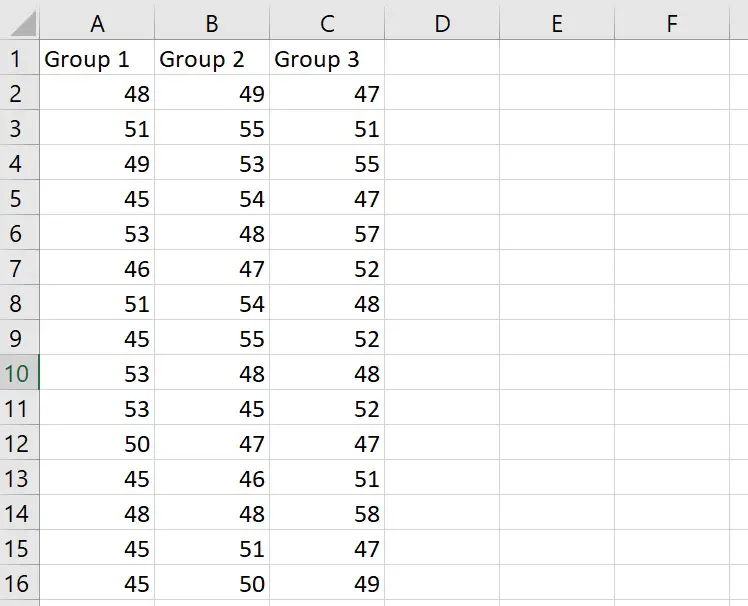
And as you can see, I have 15 participants in each group.
So, that’s an overview of my example data.
What I want to do now is to perform a one-way ANOVA to determine if there is a significant difference between the average height measures of my 3 groups.
Installing the Analysis ToolPak
To be able to perform the one-way ANOVA test easily in Excel, it’s best to install or activate the Analysis ToolPak. This is an add on created by Microsoft to provide data analysis tools for statistical analysis.
To install the toolpak, go to File>Options.
Then click on Add-ins.
At the bottom, you want to manage the Excel add-ins and click the Go button.
Then ensure you tick the Analysis ToolPak add-in, and click OK.
Now, when you click on the Data ribbon, you should see a Data Analysis button in a sub-section called Analyze.
Now we are ready to perform the one-way ANOVA.
How to perform a one-way ANOVA in Excel
To perform a one-way ANOVA in Excel, Go to Home>Data Analysis.
Then select ANOVA: Single Factor and click OK.
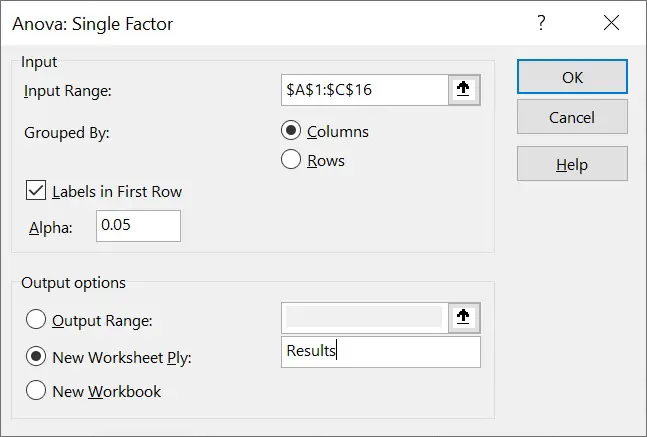
The first thing you need to do is to select the Input Range; this is essentially the data we want to run in the analysis. You can highlight the labels in the first row if you want (more on this shortly).
Next, you need to select how the data are grouped (in columns or rows). In my example, I will select the by columns option because each group’s data is in a separate column. If your data was entered in rows instead of columns, you could select the Rows option.
If you highlighted the labels in your first row when selecting the input range, then tick that option.
The next option is to specify your alpha level.
This is essentially your significance threshold. Usually this is set at 0.05, meaning that if the P value is ≤0.05, you would reject the null hypothesis and accept the alternative hypothesis.
I will keep this set at 0.05 for this example
Finally, you need to select the Output options.
There are 3 choices here:
- Output Range – Lets you highlight a region within the sheet where you want the results to be entered
- New Worksheet By – Have the results placed on a new worksheet, and you can give that sheet a name
- New Workbook – Place the results in a completely separate Excel file
For my example, I’ll select the second option and call the sheet Results.
Finally, select OK to run the one-way ANOVA test.
Interpretation of the results
I’ll now interpret the one-way ANOVA results given by Excel.
Summary table
The first table presents a summary of the data in the analysis.

Here you will find:
- Count – The number of data points in each group
- Sum – The total value if all data points were added up
- Average – The mean value in each group
- Variance – The average of the squared differences from the mean; it is simply a measurement of the spread between numbers in a data set
ANOVA table
So that’s a look at the summary table, let me now focus on the ANOVA results table underneath.
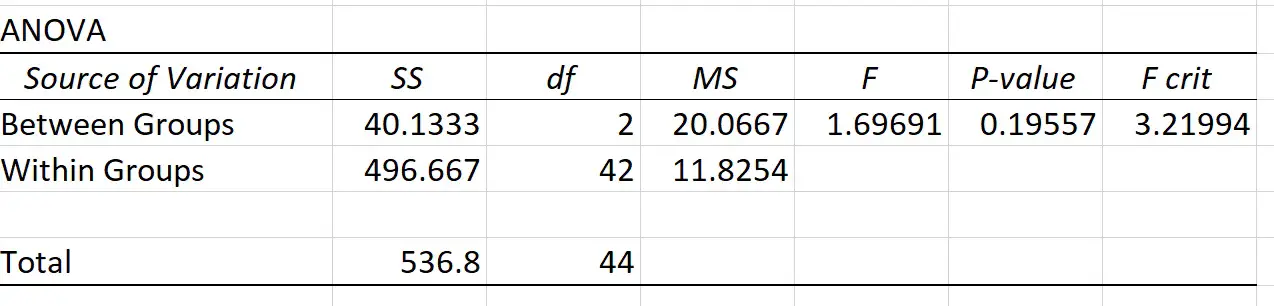
The results here are split into three rows.
- Between Groups – The results when the between groups is classed as the source of variation
- Within Groups – The results when the source of variation is within groups
- Total – The sum for the SS and df for the first 2 rows
Each column of the table represents a different output. I’ll now briefly explain what each are:
- Sum of squares (SS) – Quantifies the variability either between the groups, or within the groups
- Degrees of freedom (df) – The df between groups is calculated by subtracting 1 from the number of groups in the analysis (e.g. 3-1); the df within the groups is calculated by subtracting the number of groups in the analysis from the total number of observations (e.g. 45-3)
- Mean square (MS) – The average variation between or within the groups, depending on the row you are looking at. It is calculated by dividing the SS by the df
- F statistic (F) – The test statistic in the one-way ANOVA test
- P-value – The P value for the one-way ANOVA test
- F crit – The F critical value; this is calculated based on the F and df values
Before I interpret the P value for the one-way ANOVA test, let me describe my null and alternative hypotheses.
Null hypothesis
There is no difference between the means of my 3 groups
Alternative hypothesis
There is a difference between the means of my 3 groups
So, remember before when you specified your alpha value?
In this example, the alpha was was 0.05. This means that when P ≤0.05, we will reject the null hypothesis and accept the alternative hypothesis. Or, when P >0.05, we will accept the null hypothesis and reject the null hypothesis.
So, since my P value is greater than my alpha value of 0.05, we will fail to reject the null hypothesis.
Therefore, there is no difference between the means of my 3 groups. In other words, each group on average performed more or less the same on the vertical jump test.
Post-hoc testing
Now, if your one-way ANOVA result was significant (P≤α), then the test can only tell you that there is a difference between the group means.
It’s very important to understand that the test will not tell you where these differences lie. So, you will not know which specific group is different from the rest.
To investigate significant results further, you will need to perform post-hoc tests.
There are many types of post-hoc tests available, such as Tukey, Bonferroni and Holms’.
I’ll discuss these in more detail and show you how to perform these in Excel in future tutorials.
Wrapping up
And that’s it.
In this tutorial, you have learnt how to perform a one-way ANOVA test in Microsoft Excel, and you also know how to interpret the results.
Microsoft Excel version used: 365 ProPlus

")
