What is Cohen’s d?
Cohen’s d is a type of effect size between two means. An effect size is a quantitative measure of the magnitude for the difference between two means, in this regard.
Cohen’s d values are also known as the standardised mean difference (SMD).
Since the values are standardised, it is possible to compare values between different variables.
What is the Cohen’s d formula?
There are actually a few Cohen’s d formulas. In this guide, I will explain the two main ones: Cohen’s d and Cohen’s ds.
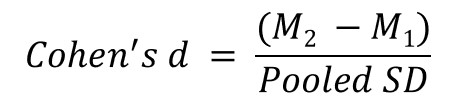
Specifically, the formulas are the difference between two means and divided by a pooled standard deviation (SD).
Cohen’s d (equal group sizes)
The Cohen’s d formula is based on two groups with the same group sizes (n). Therefore, since this is assumed, no n is required in the equation.
The formula for Cohen’s d can be seen below.
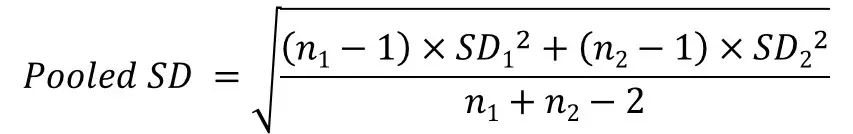
In this regard, the pooled SD is used since the population SD is usually unknown. The pooled SD is calculated based on the sample SDs by using the equation below.
 The components of the formulas are:
- M1 = The mean of group 1 (e.g. control group)
- M2 = The mean of group 2 (e.g. experimental group)
- SD1 = The standard deviation of group 1
- SD2 = The standard deviation of group 2
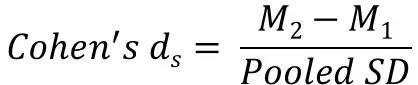
Cohen’s ds (unequal group sizes)
Unlike the first formula, the Cohen’s ds variant can account for unequal group sizes. Therefore, to use this the group sizes (n) needs to be known.
The formula for Cohen’s ds is similar to the Cohen’s d, however, the calculation for the pooled SD is different.
This time, the pooled SD is calculated as follows.
The components of these formulas are:
- M1 = The mean of group 1 (e.g. control group)
- M2 = The mean of group 2 (e.g. experimental group)
- SD1 = The standard deviation of group 1
- SD2 = The standard deviation of group 2
- n1 = The size of group 1
- n2 = The size of group 2
Calculating Cohen’s d by using an example
Now you know the formulas, let’s use them in an example.
Cohen’s d formula
We want to calculate the Cohen’s d between two groups: male and females. Specifically, a certain protein was quantified in the blood of the two groups. Females had higher levels of the protein (1.062 ± 0.339) than males (0.528 ± 0.382).
Therefore, the four components for the equation are:
- M1 = 0.528
- M2 = 1.062
- SD1 = 0.382
- SD2 = 0.339
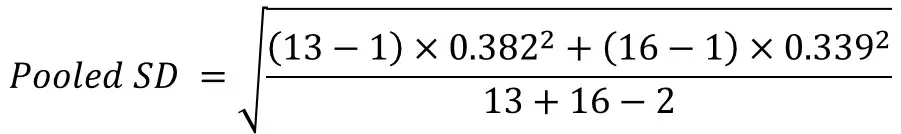
The easiest way to calculate d values is to firstly calculate the pooled standard deviation. Thus, taking these values and entering them into the equation are shown below.
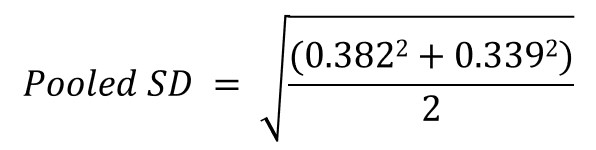 Doing so will give a pooled SD value of 0.361.
So, now we can put this value into the Cohen’s d equation along with the two group means. The full equation is displayed below.
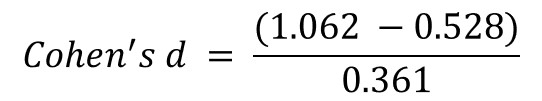 Plugging all of that into a calculator will give a d value of 1.479.
Cohen’s ds formula
Let’s use the same example data but add in different group numbers. Say there were 16 females and only 13 males.
So the data to be entered into the equation will be:
- M1 = 0.528
- M2 = 1.062
- SD1 = 0.382
- SD2 = 0.339
- n1 = 13
- n2 = 16
Again, let’s start by calculating the pooled SD. Since we are now using the Cohen’s ds formula, the pooled SD calculations will be as follows.
By carefully calculating this, the pooled SD value comes to 0.359.
Now, entering this into the overall equation will look like this.
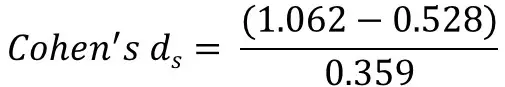
Putting this into a calculator comes out with a value of 1.489.
The Cohen’s d online calculator
If you are still struggling to calculate d values by using the formula, we have created a Cohen’s d calculator.
To use the calculator, simply enter the group mean and standard deviation values, and the d effect size will be calculated for you.
How to interpret Cohen’s d effect sizes
Simply, you can think of Cohen’s d values as SDs between the two groups. A value of 1 indicates that the means of the two groups differ by 1 standard deviation.
Taking our example from before, a value of 1.479 indicates the mean differences between the male and female groups differ by 1.479 standard deviations, which is quite a large effect as you will see.
What are small, medium and large effect sizes?
After calculating d values, people often state if the effect size is either: small, medium or large.
Cohen himself interpreted the d values into three subgroups (0.2, 0.5 and 0.8). However, these values are just general interpretations and should not be used strictly.
Small: d = 0.2
Small effect sizes are considered too small to be differentiated by the naked eye.
Cohen gave the example of a small effect size as, the difference in height between 15- and 16-year-old girls.
Medium: d = 0.5
Medium effect sizes are just larger enough to be seen by the naked eye.
Elaborating on this, Cohen explained that the difference in height between 14- and 18-year-old girls would be calculated as a medium effect size.
Large: d = 0.8
Large effect sizes are really obvious differences between groups.
Keeping in alignment with Cohen’s examples, he described this size to be observed when comparing 13- and 18-year-old girl heights.
References
Cohen, J. (1988). Statistical Power Analysis for the Behavioral Sciences. New York, NY: Routledge Academic.
Lakens, D. (2013). Calculating and reporting effect sizes to facilitate cumulative science: A practical primer for t-tests and ANOVAs. Frontiers in Psychology, 4:863. doi:10.3389/fpsyg.2013.00863


Thank you. Dr. Steven. (from Korea)
Thanks! Was looking for an example with actual numbers and calculations and this is just that!
You are very welcome 🙂
Thank you Steven. It has helped me to understand a scientific journal tables. With this knowledge I can go further.