In this article, I will explain what a forest plot is and describe the different components of a forest plot by using an example so it is easier to understand.
What is a forest plot?
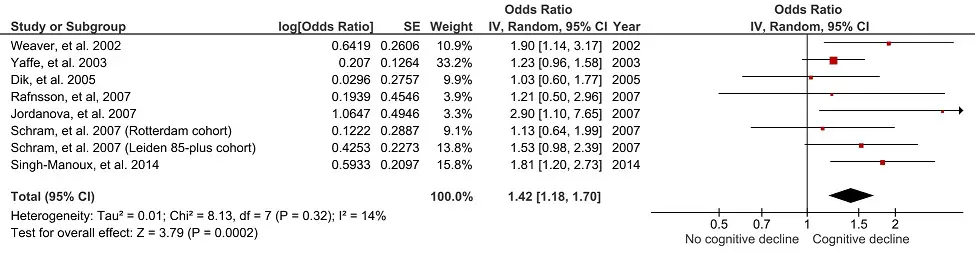
A forest plot is a figure, frequently used in meta-analyses, which displays the results from similar individual studies stacked on top of one another with the overall summary measures at the bottom. Below is an example of a forest plot created using RevMan 5.
How to read a forest plot
At first sight, a forest plot can seem quite confusing. However, when deciphered, it is relatively simple to read. Let’s take the example plot above and break it down into digestible chunks.
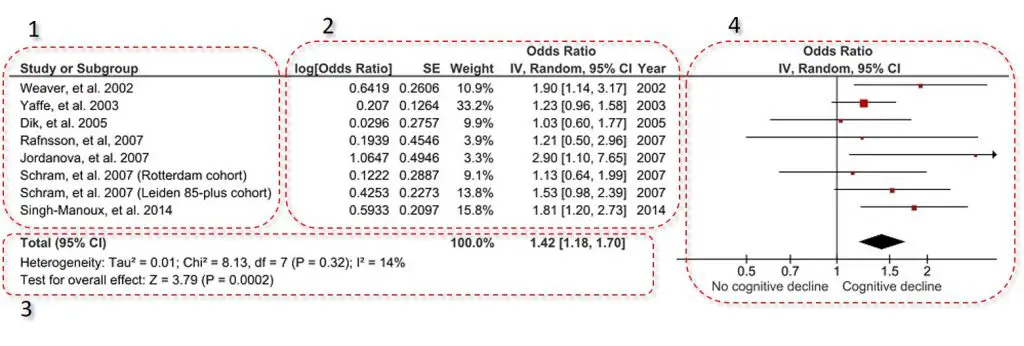
 1. Included studies
The included studies are usually placed in the far-left of the plot. This contains a list of the studies represented by the first author of the publication and the year it was published.
2. Effect estimate information
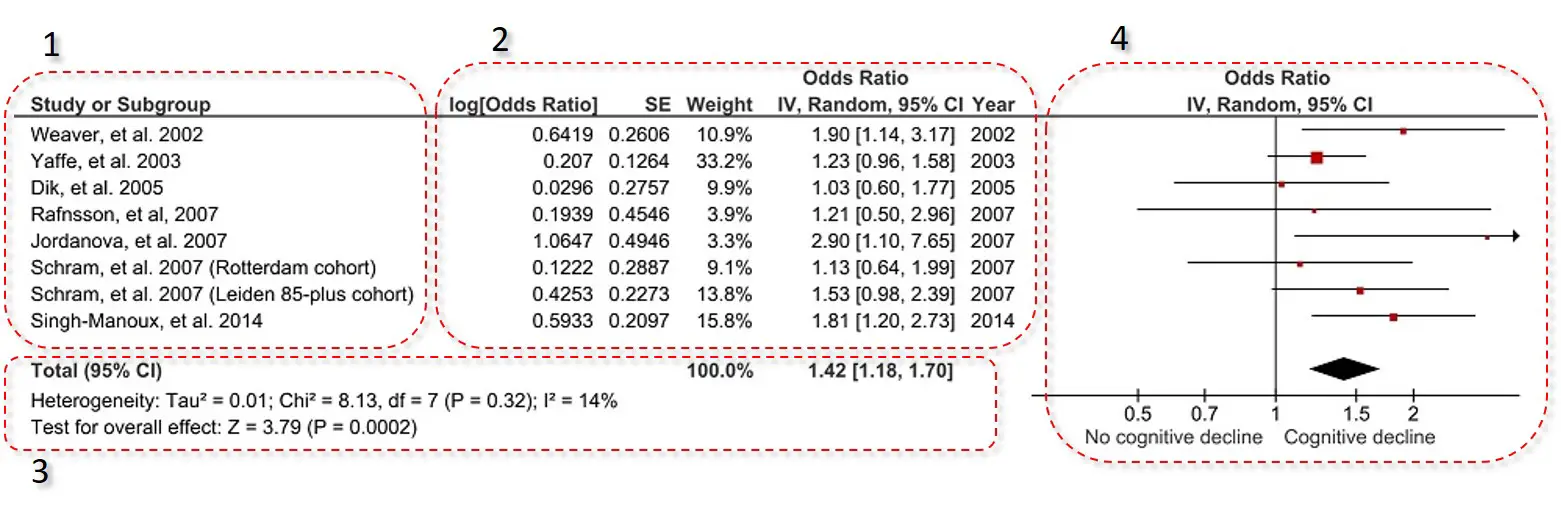
Next to the list of the included studies, are extra information on the studies effect estimates. In the example, the effect estimate measured were odds ratios (ORs). So the extra information was the log OR with the standard error (SE), as well as the actual OR and the 95% confidence intervals (CIs). This is the data which is plotted on the forest plot on the right.
Often found in this section is the study weight. The study weight is the power of the study. Generally, those studies which have lower variation, i.e. tighter 95% CIs or a higher n number, have a higher weight. Therefore, the higher the weight the more influence that study will have on the overall effect.
In this example, there is also an extra column titled Year. This lists the year of the included studies.
3. Overall statistics
Underneath the list of the included studies with their extra information is the overall statistics. Within this, there are two statistics presented: heterogeneity and overall effect.
Heterogeneity
The heterogeneity tests aim to determine if there are variations between the included studies, which may not be due to chance. Ideally, there should be zero heterogeneity between the included studies, thus indicating their suitability to be pooled into a meta-analysis. The test P value is quoted in brackets, in the example above this is ‘0.32‘, which would indicate no heterogeneity between the included studies.
Furthermore, RevMan includes the I2 statistic. The I2 statistic is presented as a percentage and represents the total variability in the studies effect measure which is due to heterogeneity. These values are often placed into three categories: no/low (<25%), moderate (25-50%) and high (>50%) heterogeneity.
Overall effect
The statistic of interest for a meta-analysis is the overall effect. In other words, when taking all of the included studies together, is the overall effect significant. In the example above, the overall effect P value is ‘0.0002‘, which indicates a very significant result.
4. Forest plot
This is the actual forest plot itself. I have annotated the example further below.
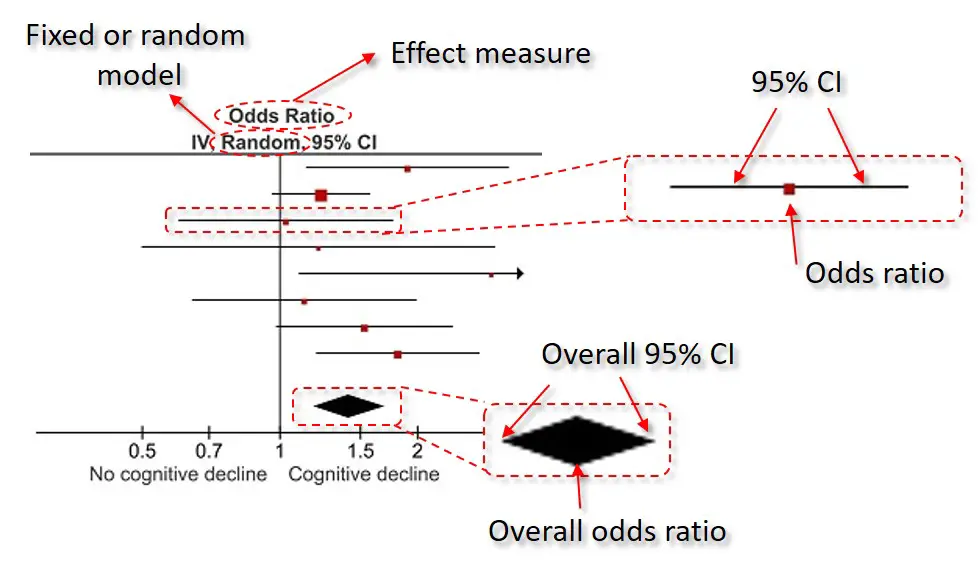
At the top of the plot, it will state the effect measure being plotted, in this case, odds ratios, as well as the type of model used (either a random- or fixed-effects model).
The plot itself contains the corresponding effect measure, indicated by a coloured dot, with the 95% confidence intervals (CIs) as whiskers. At the bottom, the overall effect measure is indicated by the middle of the diamond, with the 95% CIs at either side.
The axis at the bottom, in this example, is showing the range of ORs. The vertical line running up at ‘1‘ indicates no change in the effect measure, i.e. an OR of 1. When a studies whisker overlaps this vertical line, this indicates that there were no significant differences in that study. However, if the whisker separates from this line, this demonstrates a significant effect. This same concept is also true for the overall effect at the bottom.


It was perfect!
Thank you
thank you.Well explained
Very useful. Clear and easy to understand
Many thanks for the feedback