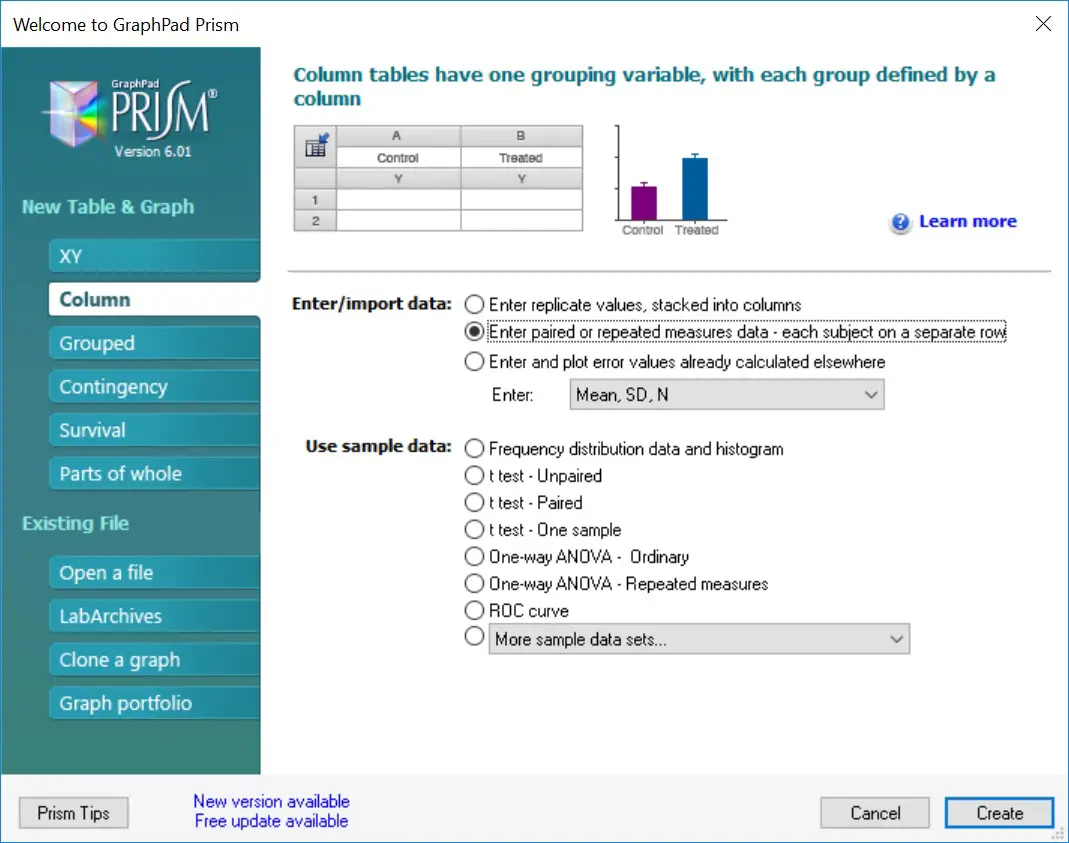
To perform a paired (dependent) T-test in GraphPad Prism you will need to enter two groups of data into separate columns. Upon opening GraphPad Prism, select the ‘Column’ type for the ‘New Table & Graph’ option. Then select ‘Enter paired or repeated measures data – each subject on a separate row’ as the ‘Enter/import data’ choice.
 Alternatively, you can go to ‘File > New > New Data Table & Graph …’.
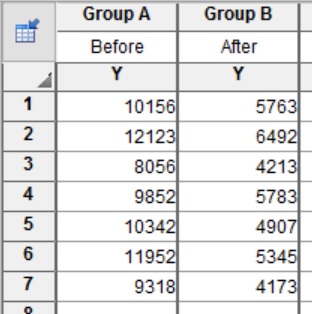
For this tutorial, I will use an example of comparing the number of viable cells before and after a 6-hour treatment with drug X. The data is entered into two columns labelled ‘before’ and ‘after’.
 Our null hypothesis will be:
“There is no difference in the number of viable cells before and after a 6-hour treatments with drug X”.
And our alternative hypothesis will be:
“There is a difference in the number of viable cells before and after a 6-hour treatments with drug X”.
Performing the paired T-test
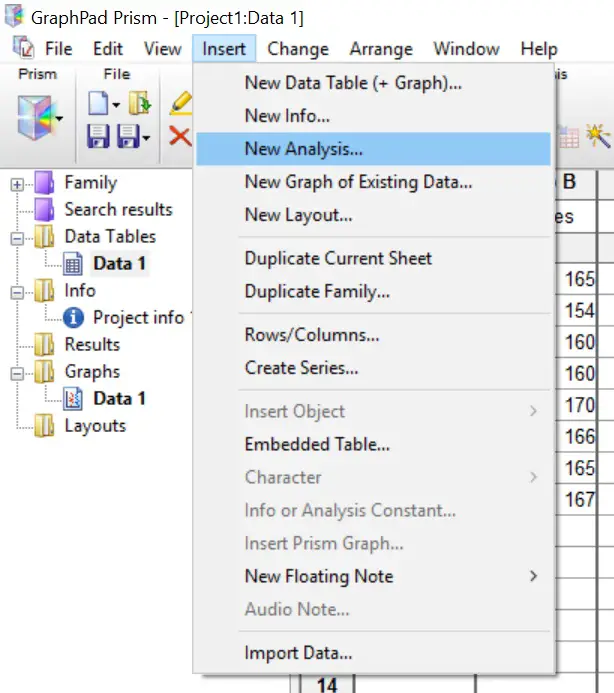
To perform a paired t-test, first go to ‘Insert > New Analysis …’.
 This will open a new window. Here you need to tell GraphPad which test to perform. Select the ‘t tests (and nonparametric tests)’ analysis and make sure the two datasets are ticked on the right window.
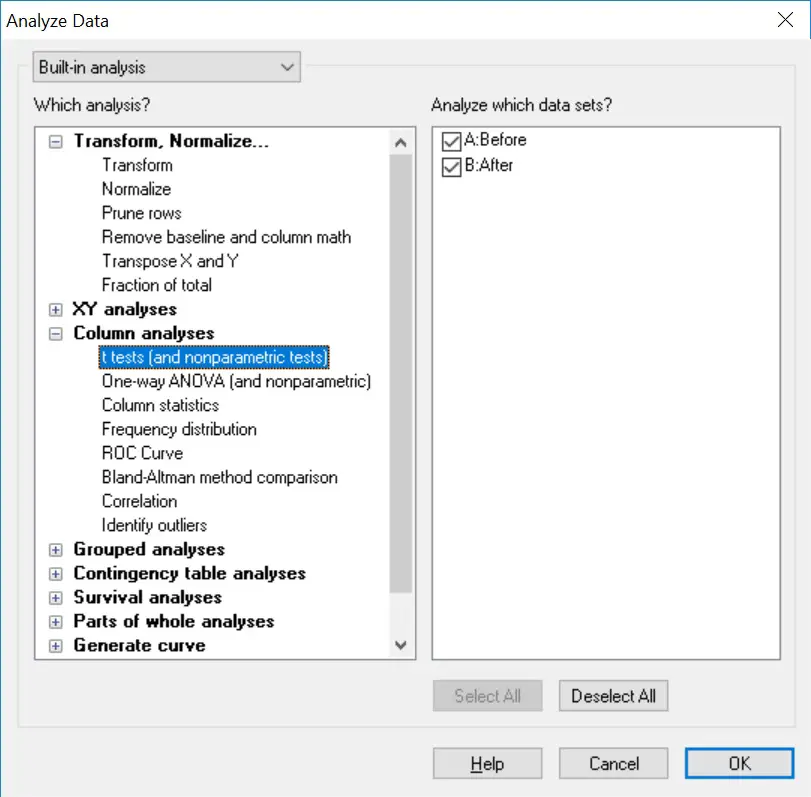 Click the ‘OK’ button.
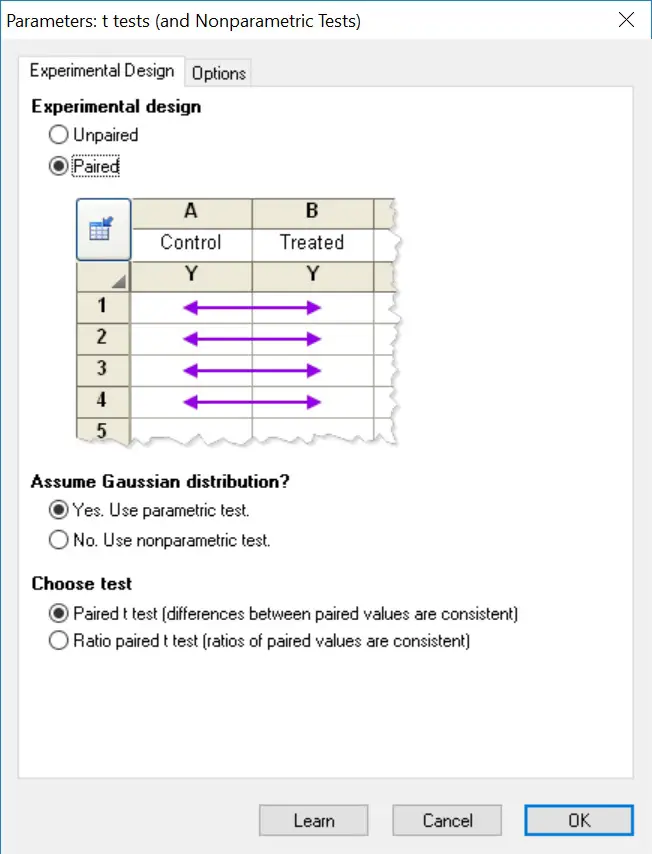
The next window will ask you to specify whether the T-test is an unpaired (independent) or paired (dependent) test. In this case, select the ‘paired’ option.
Also, select whether the test will be a parametric or nonparametric test. Under ‘Assume Gaussian distribution’, select ‘Yes. Use parametric test’. This will ensure a paired T-test is performed.
The final option titled ‘Choose test’ refers to whether your two datasets have equal variance. Select, ‘Paired t test (difference between paired values are consistent).’
 If you want to change any other settings, such as the confidence level, go to the ‘Options’ tab. For our purpose we are going to leave everything in the default settings, but will select ‘Descriptive statistics for each data set’ which will produce the mean and standard deviation for each group.
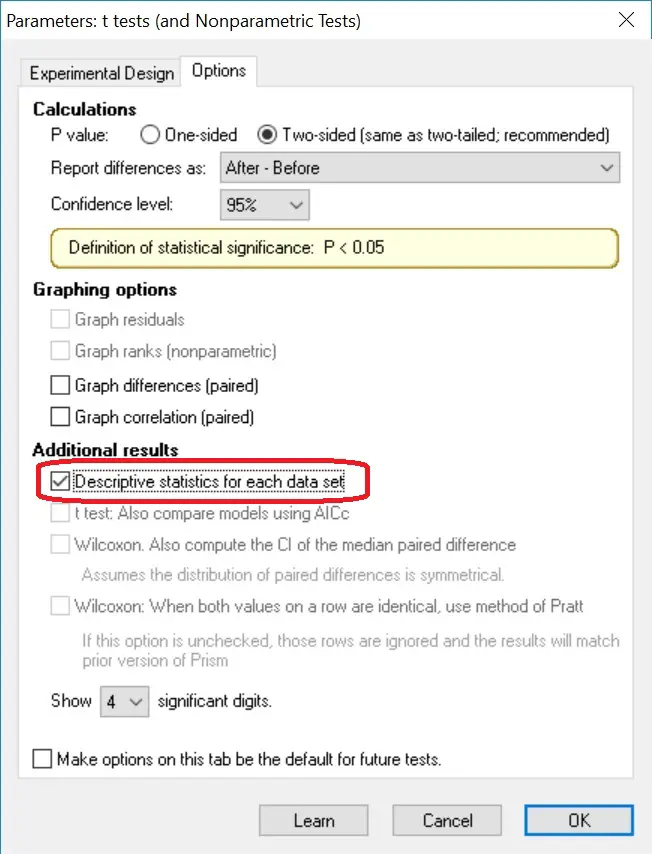 Click ‘OK’ to perform the test.
Output
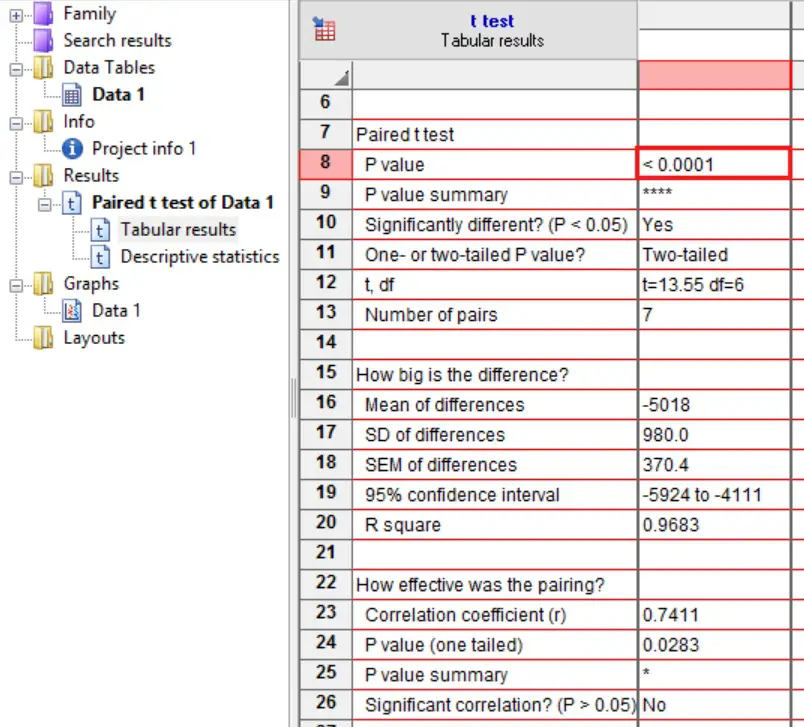
The great thing about GraphPad Prism for statistical testing is that the output is very user friendly and self-explanatory. All you need to do is to refer to the ‘Paired t test’ section.
 Each output is as follows:
- P value – The exact p value.
- P value summary – A summary of the p value as represented by asterisks. These are useful to signify the level of significance on graphs, for example.
- Significantly different? (P<0.05) – A straight yes or no answer for the paired t test.
- One- or two-tailed P value? – Whether a one- or two-tailed paired t test was performed.
- t, df – The t statistic and the degrees of freedom in the analysis.
- Number of pairs – The number of pairs of data in the analysis.
GraphPad also gives you other descriptive information for each dataset (under the ‘How big is the difference?’ section) and an indication for how effective the pairing between the datasets was (under the ‘How effective was the pairing?’ section).
Interpretation
By looking at the ‘Significantly different? (P<0.05)’ output, a ‘Yes’ is given which essentially means that our results are significantly different from each other. The exact p value is given next to ‘P value’. In this case a p value of < 0.0001 indicates a very significant difference, since this is less that our level of significance threshold of 0.05.
So, after performing the paired T-test in GraphPad we now know that there is a significant difference between the number of cells before and after the treatment with drug X for 6-hours. In which case, we reject the null hypothesis and accept the alternative hypothesis.
Reporting
If we were to report the results of this paired t test in a single sentence, we could write:
“There was a higher number of cells before (10257 ± 1430 cells) than after (5239 ± 861 cells) a 6-hour treatment with drug X, t(6) = 13.55, p < 0.0001.”
This includes the mean and standard deviation (this information can be found in the ‘Descriptive statistics’ sheet) for each group, as well as the t statistic, degrees of freedom and the all-important p value.


