In this article, I will show you how to perform a Spearman rank correlation test by using GraphPad Prism. I will also show you how to interpret and report the results.
Assumptions of the Spearman rank correlation test
Before running the test, there are just 2 assumptions that the data has to pass. These are presented below.
- The two variables should be measured on either an ordinal, interval or ratio scale.
- There should be a linear relationship between the two variables. This can be tested by plotting the variables on a scatterplot.
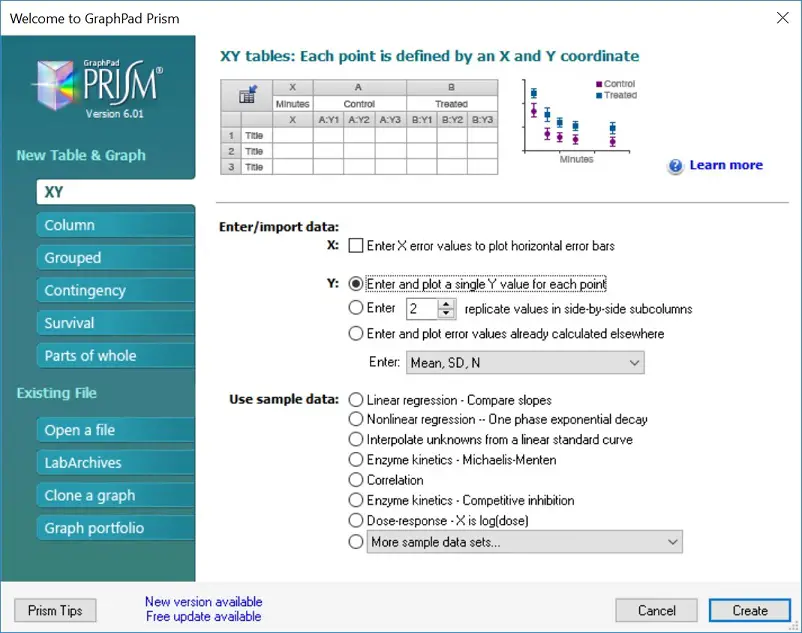
Setting up the GraphPad sheet
To begin with, set-up the GraphPad sheet so that an ‘XY‘ table and graph type is selected. Then, select the ‘Enter and plot a single Y value for each point‘ option. Finally, select the ‘Create‘ button to open up the new sheet.
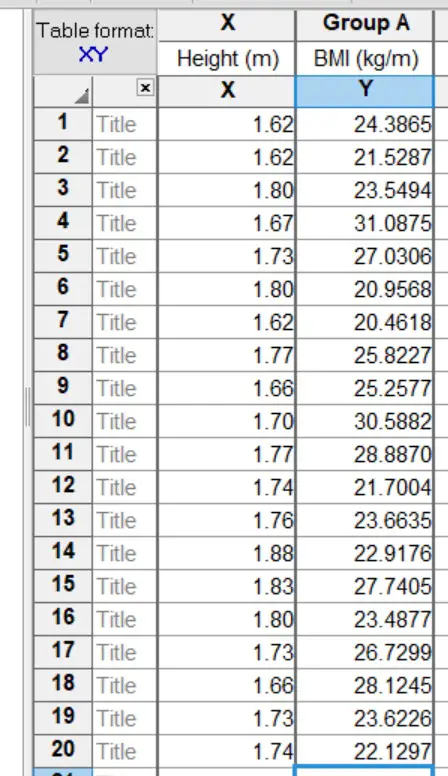
 Example dataset
In this example, I have measured the height and body mass index (BMI) of 20 individuals. Thus, I want to see the strength of the correlation between the two variables by performing a Spearman rank correlation test.
Note that each individuals data is paired on a separate row so that their height and BMI are adjacent to each other.
The null hypothesis for this example will be:
“There is no association between the height and BMI of the individuals”.
And the alternative hypothesis will be:
“There is an association between the height and BMI of the individuals”.
Performing the test
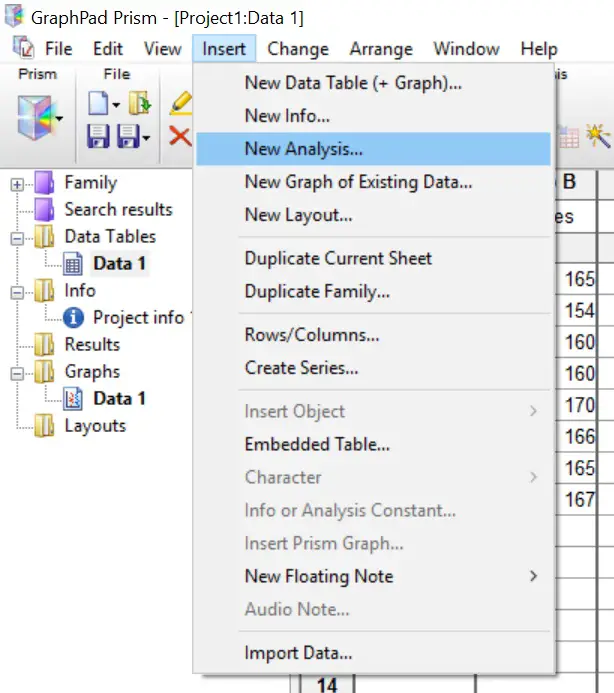
- To perform a Spearman rank correlation test in GraphPad Prism, firstly, go to ‘Insert > New Analysis …’.
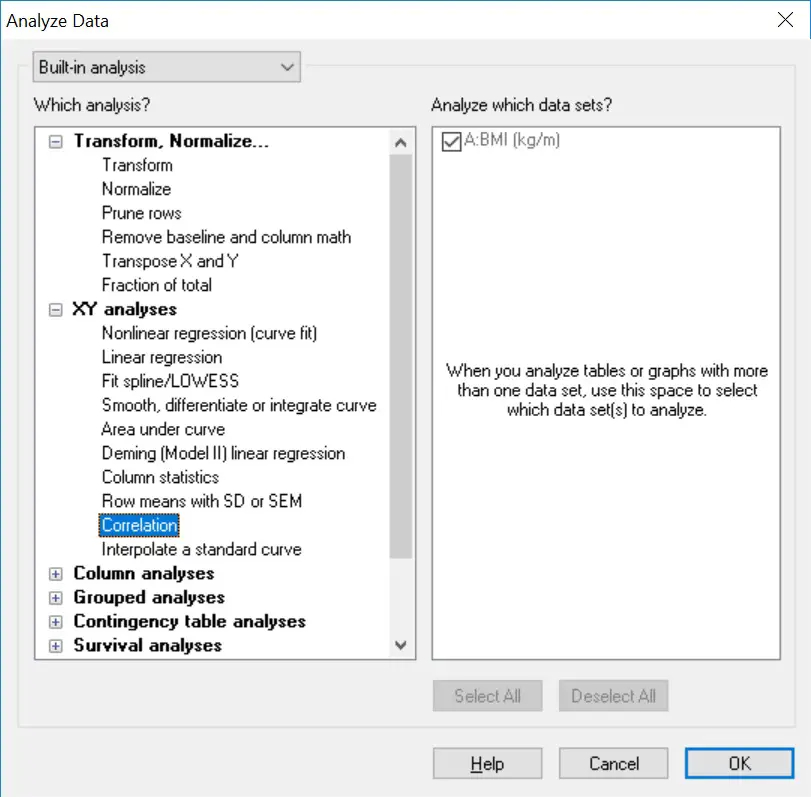
 2. Next, select the ‘Correlation‘ test option, under the ‘XY analyses‘ header. Then click the ‘OK‘ button.
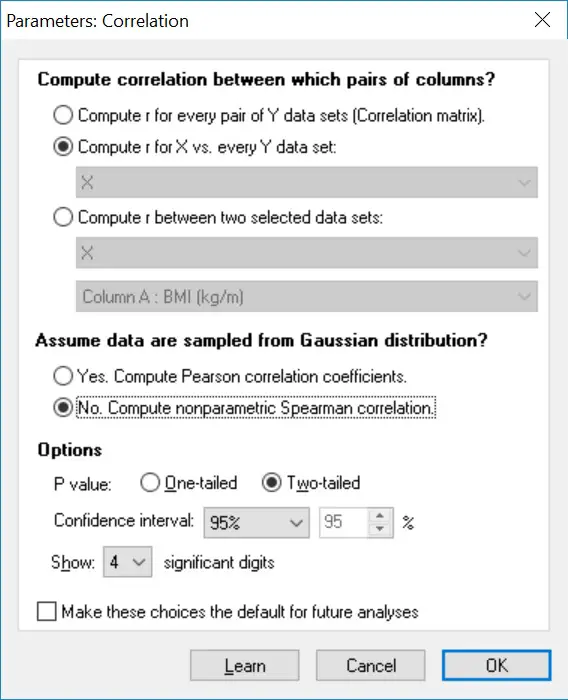
 3. In the next window, click the ‘No. Compute nonparametric Spearman correlation‘ option under the ‘Assume data are sampled from a Gaussian distribution?‘ header. This will ensure a Spearman correlation test is performed, as opposed to a Pearson correlation test. Then click the ‘OK‘ button to run the test.
 Output
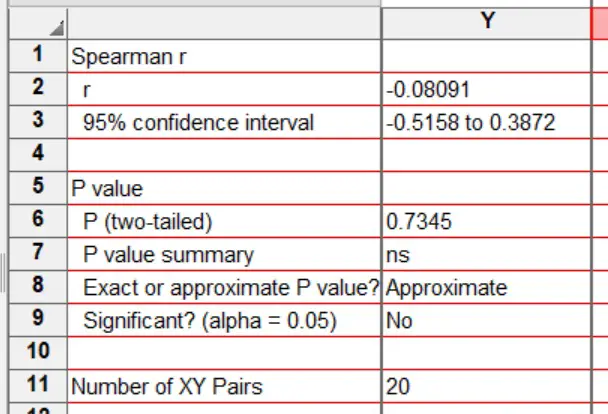
The output for the Spearman correlation test in GraphPad is rather simple. Each output is broken down below.
- r – The Spearman correlation coefficient value (rho). These range from -1 (a perfectly negative association), to 0 (no association), to 1 (a perfectly positive association).
- 95% confidence interval – The 95% confidence intervals for the r value.
- P (two-tailed) – The all-important P value for the test.
- P value summary – Denotes the strength of the P value. The ‘ns’ just means not significant.
- Exact or approximate P value? – Whether the P value is exact or approximate.
- Significant? (alpha = 0.05) – A simple ‘Yes’ or ‘No’ output for the overall significance of the test.
- Number of XY Pairs – The number of data pairs in the test.
 Interpretation
Simply looking at the ‘Significant? (alpha = 0.05)‘ output, it can be seen that a ‘No‘ is given. Thus, the test was not significant. This is also seen in the actual P value, which was 0.7345.
Therefore, the null hypothesis is accepted and the alternative hypothesis rejected.
Reporting
To report the results of a Spearman correlation test, it is best to include the correlation coefficient value to indicate the strength of the relationship between the two values, as well as the P value. I have included an example of the reporting from the example used here.

GraphPad Prism version used: 6


