In this guide I will explain what the standard error formula is and how to use it to work out the standard error through the use of an example.
What is the standard error?
The standard error (SE), sometimes referred to as the standard error of the mean (SEM), is a statistic that corresponds to the standard deviation of a sampling distribution, relative to the mean value. But what actually is that?
Say you are interested in the average age people in the UK are diagnosed with Alzheimer’s disease. It is not feasible to determine this for everyone in the UK, therefore researchers take a sample population to generalise an overall figure. For example, 10,000 British people with the disease may be analysed and will be used to generate the average age of diagnosis. If you do this on a random sample of 5,000 patients, you may get an average age of diagnosis of 61.5 years. However, if you do the sample analysis on a separate random sample of 10,000 other patients, you may get an average age of 62.3 years. Let’s say, hypothetically speaking of course, that if you were able to analyse all of the people in the UK who have Alzheimer’s disease to get the actual figure, you may end up with 64.3 years. You can notice that the figures gained from the sample populations (61.5 and 62.3 years) differs to the actual figure (64.3 years). This variation in mean values is expected, and as you increase the number of people in your sample population you will get a value which is closer to the actual figure. This is exactly what the standard error represents. The standard error signifies this variation in the mean values between the sample populations.
For further reading, I suggest you read the short Statistics Note by Professors Douglas Altman and Martin Bland published in the British Medical Journal. It is a helpful insight into what the standard error is and what the difference with the standard deviation.
The standard error formula
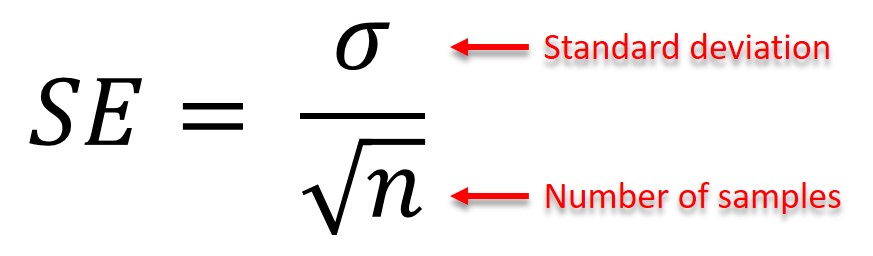
To calculate the standard error, you need to have two pieces of information: the standard deviation and the number of samples in the data set. The standard error is calculated by dividing the standard deviation by the square root of the number of samples.
Here is the full annotated standard error formula:
 Example
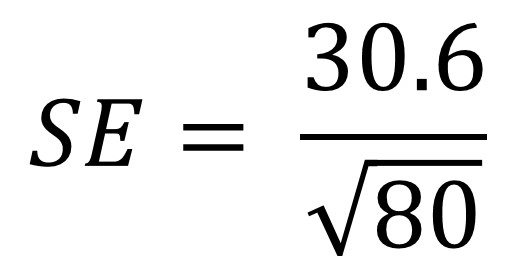
To understand the standard error formula better, it may help to go through an example. Say we have a population of 80 people and we are interested in their height. We measure their height and calculate the standard deviation as 30.6 cm. We now need to plug these values into our equation:
 If you are uncomfortable with inputting equations into calculators, you can break down the formula into manageable chunks. Here are the steps you can take.
- Firstly, calculate the square root of the number of samples (n). In this case, n is 80. The square root of 80 is 8.94.
- Next, divide the standard deviation (30.6) by the square root of 80 (8.94). Doing this gives a value of 3.42.
- Therefore, the standard error in our population for height is 3.42 cm.


