What is a Z-score?
A Z-score, also known as a standard score, represents the number of standard deviations (SDs) a data point is away from the average (mean) of the group. Z-scores, therefore, are a useful way of standardising values.
After converting to Z-scores, the average will always be 0 and the SD will be 1. This makes interpretation of the data far easier.
If the Z-score is positive, it means the score is above the average value, whereas a negative Z-score indicates the score is below the average.
The Z-score formula
To understand the Z-score better, it will be useful to refer to the Z-score formula. Below is the Z-score formula, which is actually very simple.
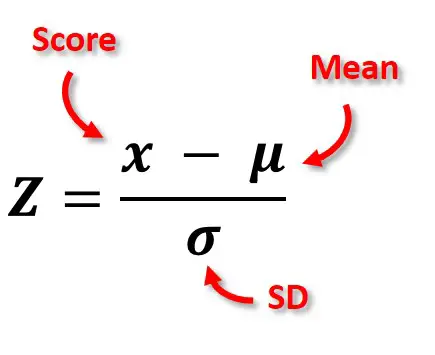 There are just three aspects to the formula: score (x), mean (μ) and SD (σ).
- x – The score is the original score/data point to be converted.
- μ – Mean is the average value for the population studied.
- σ – The SD of the population studied.
When using the formula, the mean and SD values will stay constant, only the score to be converted will be changed.
Using the Z-score formula with an example
So, let me use an example to demonstrate how to use the Z-score formula. Below is a set a ten scores on a memory test from a population of 10 people.
The mean score and SD of this dataset are 4.5 and 2.22, respectively.
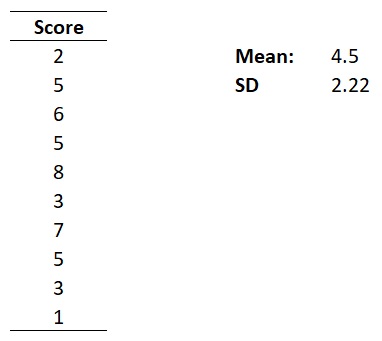
When interpreting this dataset, it is difficult to understand those individuals who scored better than average. This is where Z-scores can help.
To calculate the Z-score for each score, each score must be separately entered into the formula. Instead of showing you how to do this for each score, below I have entered the first score (2) into the formula to demonstrate how it works.
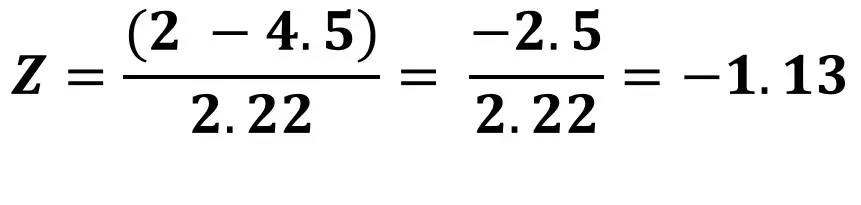 In this example, the Z-score is -1.13. This means that this score is 1.13 SDs below the average population value. Interpreting this score would imply that this individual scored below the average on the test. Not great!
Repeating this process for all of the examples will give the following Z-scores.
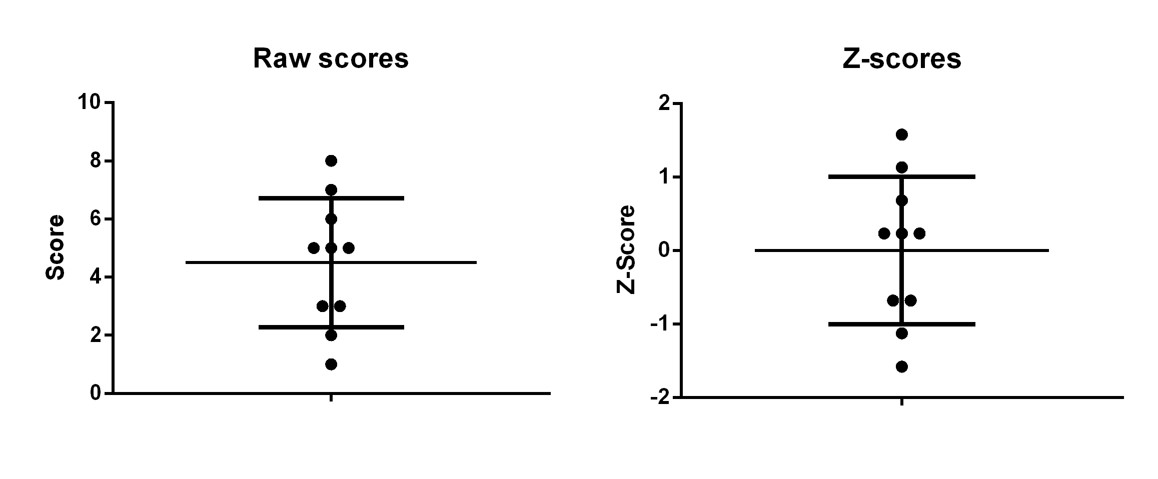
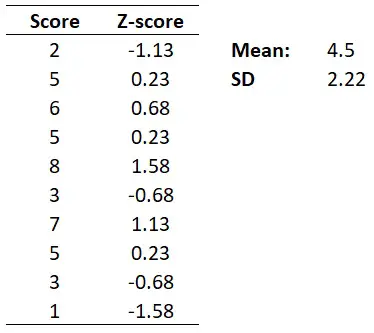 If the scores and Z-scores from the example were to be plotted, it would look like the graphs below. Notice how the average value for the Z-scores is now 0 and the SD is 1. Also, that by converting to Z-scores, this does not change the distribution of the data.

 Why use Z-scores?
There are two main reasons why Z-scores are applied: interpretation of data and enabling comparisons of different variables.
1. It makes interpretation easier
As we have seen, converting scores to Z-scores makes life a whole lot easier when interpreting the data. Individual scores can be compared against the mean of that group.
2. Enables comparisons between two different variables
Since Z-scores are arbitrary standardised values, it is possible to compare Z-scores from two different variables. For example, comparing the height of individuals and the weight of an individual. Despite these being measured on different scales, Z-scores enables comparisons of scores within their distribution.


