In this tutorial, I will show you two completely different ways of performing random sampling in Microsoft Excel.
What is random sampling?
Random sampling is a selection technique used where you take a population and randomly select a wanted number subjects to make a smaller group known as a sample.
During random sampling, each subject has an equal chance of being selected in the sample.
Random sampling in Excel: Method 1
For the first method, I wil perform random sampling my using Excel’s Analysis ToolPak add-on. The Analysis ToolPak is an additonal set of options that can help you perform certain statistical functions in Excel easily.
Step 1: Activate the Analysis ToolPak
To ensure you have the Analysis ToolPak activated correctly, go to File>Options.
Then, select Add-ins.
At the bottom, where it says manage, ensure you select Excel add-ins and click Go.
Ensure you have the Analysis ToolPak option ticked, and click the OK button.
Now, when you select the Data tab at the top, you should see a Data Analysis button appears.
Step 2: Use the Analysis ToolPak to perform random sampling
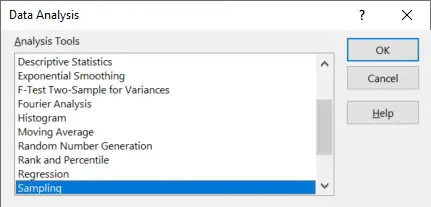
Now we’re ready to perform the sampling. To do this, select the Data Analysis button.
Then, select Sampling from the list and click OK.
For the Input options, do the following.
- Input Range – Enter the cells containing the data you are interested in from your population. Note, the cells entered here can only contain numeric values
- Labels – If you have highlighted a header in your Input Range selection, make sure you tick the labels option
Moving onto the Sampling Method, you want to select Random.
The Number of Samples is simply the number of randomly selected values from your population. For example, entering 10 will return 10 random values.
Lastly, there are three options to pick from to decide where you want the random sample to be entered.
- Output Range – This will put the sample in the current sheet. You can use the box to specify a specific cell
- New Worksheet Ply – This will put the sample in a separate worksheet. Use the box to give the new worksheet a name
- New Workbook – The last option will put the sample in a new Excel file
Here’s what my Sampling window looks like for my example.
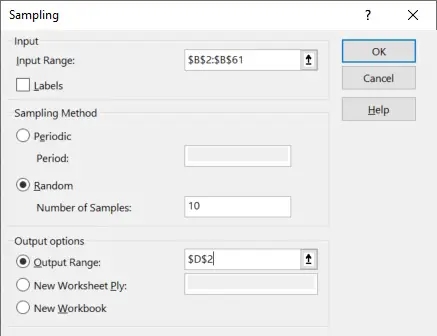
Finally, click OK to run the sampling.
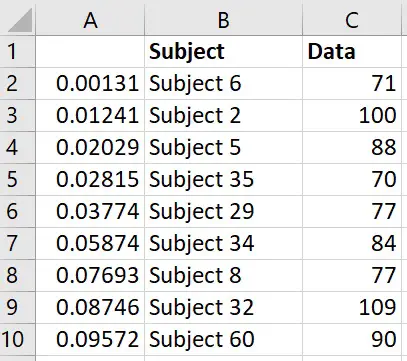
You should now see the randomly select values from the original population.
Random sampling in Excel: Method 2
The downside to using Method 1 is that you can only perform random sampling on cells containing numeric values. For Method 2, I will show you how to use the RAND function, which will enable you to randomly select different rows Therefore, you can have a mixture of cells containing numbers as well as characters in the random sample.
Step 1: Use the RAND function to generate random numbers
The RAND function creates a random number between 0 and 1, and you’ll see why this is useful for random sampling now.
In an empty column, enter the RAND function in each cell that is adjacent to your population data.
=RAND()
Notice that nothing is entered in the brackets.
A random number will now be seen. Note, everytime you perform something in Excel, this number will be recalculated. This isn’t a big issue, and I’ll show you how to manage this shortly.
Next, repeat this process for all cells that are adjacent to your population data.
To ensure the random values do not keep on updating everytime you do something in the sheet, simply highlight all the random numbers and then copy them (right-click>Copy).
Then, in the same cells, paste the values (right-click>Paste Special>Paste Values).
Now, the random function has been removed from the cells, leaving just the random numbers. This means the values will no longer update when ou make changes to our sheet.
Step 2: Sort the cells according to the random numbers
Next, highlight all the columns containing the random numbers and your population data.
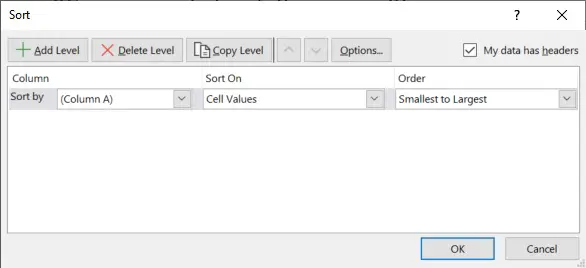
Then, go to Home>Sort&Filter>Custom Sort.
In the new window, choose to sort by the column containing the random numbers, and order these smallest to largest, then click OK.
Now, the data has been sorted according to the random numbers.
Step 3: Pick out the random sample
Decide on the number of values you want in your random sample. Then, take that number of values from the top of the sheet.
For example, I want to create a sample containing 10 values. I can simply highlight the first 10 rows in my population data copy and paste them to a new part in this sheet, a new sheet or a new Excel file.
Random sampling in Excel: Final words
You should now know two different ways of performing random sampling in Excel.
The first method uses the Analysis ToolPak to pick out a desired number of randomly selected cells containing numbers.
The second method takes advantage of the RAND function to randomise the subjects in the population, which can then be copied over to another sheet, for example.
Microsoft Excel version used: 365 ProPlus

")
