Why bother with PCR primer efficiencies?
Every time you receive a new set of primers, especially when using SYBR Green chemistry during quantitative polymerase chain reaction (qPCR), you should always run a standard curve to calculate the efficiency of your PCR primers.
The reason we bother calculating PCR primer efficiencies is to be able to correctly analyse the results. For the calculation of gene expression, such as the delta-delta Ct method, it is assumed that the PCR primer efficiencies are comparable for the gene of interest and for the housekeeping gene. Therefore, dissimilar PCR primer efficiencies within your experiment can impact your final result.
Mastering qPCR
A video tutorial on qPCR primer efficiency calculation can be found in our Mastering qPCR course.
>>Use code 20QPCR to get 20% off<<
What is the correct PCR primer efficiency value?
Obviously, a perfect primer set will have a primer efficiency of 100%. In other words, for every PCR cycle, the number of copies of the PCR product will double in size during the logarithmic phase of the PCR reaction.
To get a 100% primer efficiency for all of your primer sets is highly unlikely. Therefore, it is recommended that all the primer sets used in your experiment lie between 90 – 110% efficient. If so, they are deemed comparable.
How to perform a standard curve
So you have designed and received your new primers. Now what? Well, the first thing you will need is a template to use for standard curve generation. Ideally, this should be from the same source as what will be used during your experiment. So, if you have generated complementary DNA (cDNA) from RNA extracted from a cell culture experiment, for example, then use one of these samples as your template.
To create a standard curve, it is recommended to start with the undiluted cDNA sample as your first point. From this, you need to create a serial dilution series. A 1:10 dilution is commonly used to create a standard curve with at least 5-points. If you can include more points in your standard curve, then this would be better. So long as the standard curve covers the Ct values of your experimental samples then this is fine.
Here is an example of a 1:10 serial dilution standard curve containing 5 points:
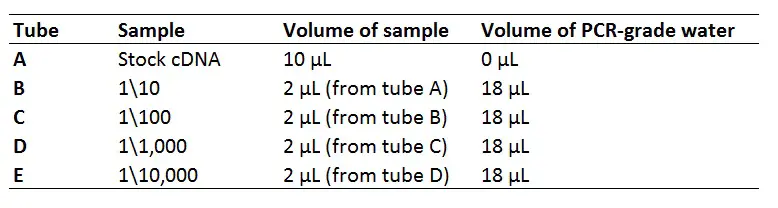 Perform a qPCR reaction using your standard curve containing the recommended reagents and concentrations for the qPCR master mix of your choice, as a starting point. Make sure to perform each sample in duplicate at the very least, or even better, triplicate. Also, don’t forget to include no template controls (NTCs), i.e. PCR-grade water instead of the sample, on your plate to identify any contamination.
How to calculate primer efficiencies
Some qPCR machines will be able to calculate this for you, but I prefer to export my raw results and calculate the PCR primer efficiencies manually.
Here is how to calculate a primer efficiency using Microsoft Excel. The Excel formula used in each section is highlighted in grey.
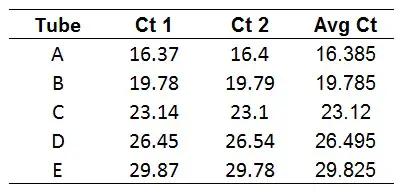
1. Calculate your average Ct values from each of your replicates/triplicates
The first step is to average the technical replicate Ct values.
The function in Excel is found below, where the Ct1 and Ct2 values represent the cells for each technical replicate.
=AVERAGE(Ct1,Ct2)
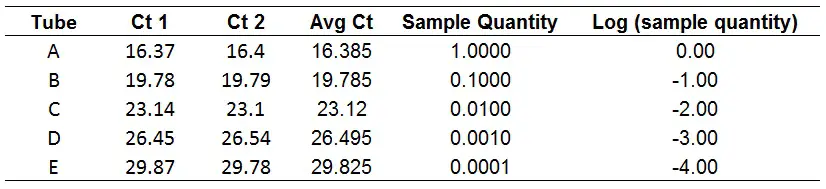
 2. Calculate the log of each sample dilution
The starting quantity is based on your dilutions. So, for example, I like to call the first value ‘1‘ since this is the stock, undiluted cDNA. Then do 1:10 dilutions of this value.
Then, the log value of these should be determined. Simply use the LOG function in Excel to do this.
=LOG(Starting quantity)
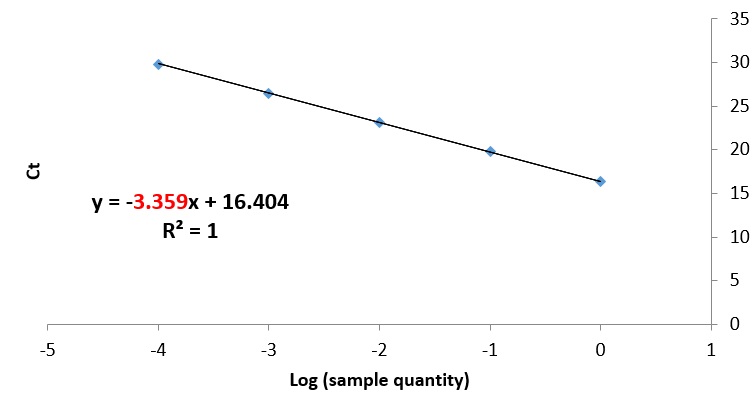
 3. Get the slope of the regression between the log values and the average Ct values
To quickly calculate the slope of the line, use the SLOPE function in Excel. Specifically, it is the slope between the log values just created and the average Ct values.
=SLOPE(Average Ct value range, log quantity range)
Alternatively, you can plot the log values against the average Ct values as a scatter plot. To do this, first, create a scatter plot between the average Ct values and the log values. Then select ‘Add Chart Element > Trendline > More Trendline Options …’. From here, select the ‘Display Equation on chart’ option to view the regression equation. The slope value will be the value at the start (just before the x). In this example, the slope is -3.359.
 4. Calculate the primer efficiency by using the slope value
Primer efficiency values are presented as a percentage. To calculate primer efficiency values, use the following equation.
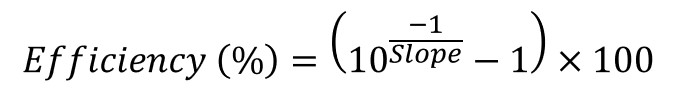 The formula to do this in Excel can be found below.
=(10^(-1/The Slope Value)-1)*100
This will give you a primer efficiency score as a percentage. Hopefully, this is between 90 – 110%. By using the above dataset, the efficiency comes to 98%.
If your standard curve and primer efficiency is not within the desired range, don’t worry. There are a few things you can do to improve your PCR primers efficiencies, such as adjusting the primer concentrations and the annealing temperature of your reaction. If you are really struggling after that, then I suggest designing new primers.
PCR primer efficiency calculator
If you prefer, I have created a PCR primer efficiency online calculator. To use this, simply enter the slope of the line, as determined above, and the calculator will return the primer efficiency value and the amplification factor (E).
Free PCR primer efficiency Microsoft Excel template
Are you still struggling to calculate your PCR primer efficiencies? Well, I have made an Excel worksheet to hopefully help you out.
All you have to do is to fill in the Ct values from your replicates and the dilution factor used when making the standard curve, e.g. 10, and the sheet will (hopefully) work out the rest for you. This will also work out the slope, R2 value and the PCR primer efficiency value as a percentage.
Click here to download the template.


Hi Steven,
Many thanks for your very helpful articles. Any tips on how to reduce/prevent primer-dimers?
Thanks for the feedback!
So, you could try:
1. Reducing primer concentrations in the reaction
2. Adjusting the forward and reverse primer ratios used in the reaction
3. Adjusting the annealing temperature (usually increasing this prevents primer-dimer formation)
4. Redesigning the primers
Hi Steven,
Thank your for this very simple guide for calculating efficiency. If the neat sample has a higher CT value than the diluted sample, would this imply that the reaction is being impeded by and excess of template ?
One of the primer sets gave the following CT’s inf the order of neat to 1:10000 (34.3/31.6/34.4/37.8/undetermined). If I exclude the first Ct for neat (34.3) the primer efficiency in the range of 1:10 to 1:1000 is 109%
Moreover is it acceptable to calculate the efficiency using 4 points? Typically when I include the neat sample the results fall outside the 90-110% range, however when I include only 1:10 to 1:10,000, the efficiency is within acceptable range.
Hi Fintan,
Yes, so that does imply that the neat sample could contain PCR inhibitors, not necessarily an excess of template.
It might be worth doing a smaller dilution series (e.g. 1:4 dilutions or 1:2 dilutions, as opposed to 1:10) and exclude the neat sample from the analysis. This is because your Ct values are quite high and one sample is even undetectable. This should then give you at least 5 readings.
I hope that makes sense?
Steven
So, you could perform 1:4, 1:64,
I’l try it and see what difference it makes.
Thanks again
Hi Steven,
Great tutorial! I calculated the efficiency of one of my primer pairs and I got an efficiency of 114%. I would want to lower the efficiency so that it falls into the correct range. From what I understand I could do this by changing the concentration of my primers. My question is whether I should lower the concentration or increase it? I assume lowering it would be the best option but I could be mistaken. 😀
Thanks in advance!
Hi Joey,
Thanks for the feedback.
That is true, changing the primer concentration can help. But, the optimal primer concentration will depend on the primer sequence and target of interest (in some cases, improving the primer concentration can actually help).
The best way to determine the best primer concentration is to perform a PCR where everything is constant, but you vary the primer concentration for each forward and reverse primer. For example,
Tube 1 = 100 nM forward primer; 100 nM reverse primer
Tube 2 = 200 nM forward primer; 100 nM reverse primer
Tube 3 = 300 nM forward primer; 100 nM reverse primer
Tube 4 = 100 nM forward primer; 200 nM reverse primer
Tube 5 = 100 nM forward primer; 200 nM reverse primer
Tube 6 = 100 nM forward primer; 300 nM reverse primer
Tube 7 = 200 nM forward primer; 200 nM reverse primer
Tube 8 = 200 nM forward primer; 300 nM reverse primer
Tube 9 = 300 nM forward primer; 200 nM reverse primer
Tube 10 = 300 nM forward primer; 300 nM reverse primer
Be careful and watch out for primer-dimer though!
Additionally, you can look at adjusting the annealing temperature of the reaction slightly. This can also affect the primer efficiency.
I hope that helps.
Steven
Thanks for the help Steven!
So the best primer concentration should be assessed based on the formation of primer-dimers? I mean, the optimal combination of concentrations should the one where you see no primer-dimer formation? Also, is it best to look for the combination with the highest concentration (without primer-dimers)?
What about the sample used? Should it be the undiluted sample that I used in the primer efficiency assay?
Sorry for all the questions 😀
Thanks,
Joey
Hi Joey,
I usually pick the primer concentration that gives me the brightest band for the intended product on an agarose gel. Then I use this primer concentration in the primer efficiency test.
As for the sample, I would use a sample that you have a lot of volume for (or you can pool a bit of a few samples together so you don’t use them all) and dilute this 1:10 before doing the primer concentration test.
When I do my primer efficiency test, I usually use undiluted to start with.
I hope that makes sense.
Steven
Hi Steven,
Thanks again for the clear explanation. I have a new question though haha.
To do the PCR for the primer concentrations, it’s just a regular PCR right? I mean, to amplify my cDNA I should make a reaction mix with for example Taq DNA polymerase and only vary the concentrations of the primer pair and then afterwards verify optimal concentration on an agarose gel. Also, I use the same Temp. / cycle setup as used for qPCR? Thanks!
Hi Joey,
Yes, you ideally want to use standard PCR as the reagents are cheaper. You would then use these optimised settings on the qPCR to test the primer efficiency. There will be subtle differences in reaction mixtures for standard PCR vs qPCR, but it should be a good starting point.
This is how I have always done it 🙂
Thanks,
Steven
Hi Dr. Steven,
I recently calculated primer efficiency for 3 genes and they fall between 92-97%. How do I proceed after this for studying relative gene expression in my control versus drug treated cases?
Hi Kamuz,
I recommend using the Pfaffl method, which can account for differences in primer efficiencies.
I hope it helps.
Steven
Hello Steve ,
I have a question !Does it matter if I change the dilution factor like 1:2 series will get the same result ??
It does not matter what the dilution series is. All that you need to calculate the efficiencies is the slope of the curve.
Thanks a lot, Steven.
I was trying to understand that through other websites but your explanation was very simple and helpful.
Keep up the great work.
Sincerely,
Mostafa
Hi Steven,
It’s an extremely useful website and your explanation is so easy to follow. Thanks so much.
Thanks a lot ,the website is so helpful.
Hi Steven,
Firstly, I’m really glad I came across this webpage, it’s been very helpful and was easy to understand. I’ve been running dilutions series to check various primer efficiencies. For one pair of my primers I’ve used dilutions of both genomic DNA and cDNA, and the calculated efficiencies are vastly different (109.3% for the gDNA and 180.7% for the cDNA). Could it be that my cDNA is too dilute to start with? The average Ct of the “neat” sample was 21.37 for cDNA, as opposed to 17.58 for the gDNA.
Kind regards,
Kirstin
Hi Kirstin,
I am glad you have found the website useful 🙂
Okay so what is your target product – cDNA or gDNA? Is this qPCR for gene expression using cDNA? If efficiencies are >100% it may suggest inhibitors in the sample. You can try diluting the sample down some more or even extending the dilution series. Also, have you checked for primer dimers?
Thanks,
Steven
Hi Steven,
Thanks for your response. My target product is cDNA. I’m hoping to compare the gene expression levels of 4 separate genes against my housekeeping gene. I’m looking at 4 separate over-expression cell lines against 2 control cell lines over a 5 day time-course. The target I’ve checked with both gDNA and cDNA is my housekeeping gene.
Ideally I would have used cDNA for my entire dilution series plate, with all 5 targets, but was advised against this by my supervisor as a way to conserve my cDNA.
I don’t really see an additional peak in the disassociation curves to suggest primer dimers. There is some amplification in some of the NTCs for the housekeeping gene, the Cts are around 36/37 and the disassociation curse is at a lower Tm than the wells containing template, so this could perhaps be primer dimers?
I will try your suggestion of diluting my cDNA further, it might be that it is at too high a starting concentration. Also, do you tend to purify your cDNA after the reverse transcriptase reaction? Could it be that elements of that reaction are acting as inhibitors?
Thanks again,
Kirstin
Hi Kirstin,
I understand totally. A tip if you want to use cDNA during your primer efficiency test is to reverse transcribe additional samples you have surplus of. Or you can pool a few microlitres of some samples together to get enugh starting material.
That smaller peak could well be primer dimer. I would run this on an agarose gel to confirm though.
Also, I wouldn’t purify cDNA before qPCR as this will just be another step that can introduce variability. If there are inhibitors present, then diluting the samples should reduce this effect.
Good luck – I hope it works!
Steven
Thank you a lot! The website is sooo helpfull!!!
Hello, Dr. Steven!
This is such a great site and the excel template you provided is really useful. One of my primers have an efficiency of 114%, and since you mentioned the ideal range to be 90 – 110%, I was wondering if you would consider 114% as acceptable or whether I should start thinking about the effect of contaminants/inhibitors in my run.
Also, I want to know how you would go about troubleshooting low primer efficiencies (60 – 75%), will you change the primer concentration first or the annealing temperature? Both AGE and melting curves suggest single products in my intended product size, so I’m leaning more towards optimizing the conditions rather than redesigning primers.
Thank you again for your help!
Hi Marvin,
Many thanks for your message and I am sorry this is late getting back to you.
So in your case, I would say 114% is acceptable. I would, however, use the Pfaffl method to account for this difference to your other primer sets.
With regards to primers that have low efficiencies, this can be due to suboptimal primer design. So you may want to look at your primer sequences and possible redesign them. Or, incorrect primer conditions. This could be due to the wrong annealing temperature being used. So ideally you want to run a gradient PCR to determine the optimal annealing temperature. Also, yes you are correct, changing the primer concentrations can also help to imprive the efficiency of the primers.
Best wishes,
Steven
So thankful to have found this site. I’m learning qPCR on my own here having only had experience with good ol’ PCR many years ago and your write ups are easy enough to understand. Thanks Steven.
Many thanks for the comment JC, I really appreciate it.
Good luck with your qPCR and feel free to reach out if you get stuck.
Thanks,
Steven
Hi Steven,
I found primer efficiencies vary due to SybGreen dye on the qPCR. If I use UPL way, and it is probe, do I still need to calculate the primer efficiencies?
Best,
Lucas
Hi Lucas,
So if the probe-based assay was created by a company, usually they would optimise the primers for you. So there is generally no need to do a primer efficiency calculation. Personally, I would do one anyway just for your record.
Good luck!
Steven
Hello Steven!
I wonder why primer efficiency could be higher than 100%?
Many thanks for your comments.
Cheers
Hi Ann,
Good question! There are a few reasons why this happens. Mainly:
1. There may be primer-dimer formation. Check there are no primer dimers by running some product on an agarose gel or by checking the melt curve (if using intercalating dyes).
2. There could be PCR inhibitors in your reaction, such as ethanol. Ensure your starting material is free from potential PCR inhibitors. You can also dilute your starting material, which will dilute the inhibitors in the reaction.
3. There could be too much template added to the reaction, especially at the start of your standard curve. Try diluting the starting template further.
I hope that helps.
Best wishes,
Steven
Hi Dr.Bradburn,
first of all thank you so much for your excellent website. actually, I think the slope formula which has been shown in grey is wrong. the right one is it:
=slope(average Ct value range, Log starting quantity range).
best wishes.
Hi Mohsen,
Many thanks for your comment.
You are right! Apologies, I seem to have placed the x and y values for the SLOPE function the wrong way around. I have since amended this.
Thanks
Steven
Hi Steven :
Many thanks for the useful information. We use PCR in determination of presence/ absence of foodborne microorganisms by a kits validated by AOAC like ( foodproof® Listeria monocytogenes ,Detection LyoKit-5”Nuclease-LP. Protocol , foodproof® E.coli 0157 Detection Kit -5”Nuclease – Protocol, foodproof ®Campylobacter Quantification Kit-5”Nuclease- Protocol). Are we still needs to determine the amplification efficiency by method mentioned above? taking into account the fixed volume of sample and mix determined by kits .
Hi Safa,
Many thanks for your message. No, you should not need to perform the primer efficiencies for this assay. Mainly, this is a detection kit rather than gene expression analysis. Further, the company will have optimised the assay to work. Therefore, I would not worry about primer efficiencies for this assay.
Best wishes,
Steven
Thanks alot for that information, it is very helpful and useful. But I have a question. If my target tissue is liver and I have liver with cancer. Can I use healthy liver tissue as a standrad?
Hi Soha,
Many thanks for your message. Yes, you can use a healthy liver tissue as your standard in your case. Or, you could also pool a few samples together if you don’t want to waste all of one sample.
The main point is that the Ct values of your standards should cover the range of Ct values in your experimental samples. So if your highest standard Ct value is 16 and your lowest standard Ct value is 33, then your experimental sample Ct values need to be within Ct values of 16 – 33.
Hope that helps.
Best wishes,
Steven
Thanks for your useful information. Can we make a 1:2 dilution series for primer efficiency calculation? sometimes the PCR cannot be accomplished in a wide range of dilutions (1:10)
Hi Mehdi,
Many thanks for your comment.
Of course. Sometimes certain genes are expressed at low levels so a smaller dilution is required. Try to do at least 5 points in your dilution series. Also, ensure that when it comes to do your experiment, your Ct values are within the range of Ct values from your dilution series when you calculated the primer efficiencies.
Best of luck,
Steven
Hi Steven,
A quick question here, how can I know the Ct value is within the range of Ct values from the dilution series?
Hi Shan,
So when you perform your dilution series you will get a range of Ct values. FOr example, the lowest could be 18 and the highest 32. These numbers will depend on your experiment and genes investigated. This means your experimental samples should have a Ct values between 18 and 32.
I hope that helps.
Steven