In this guide, I will show you how to calculate the lower and upper confidence intervals (CIs) of the mean in Microsoft Excel.
Unfortunately, there isn’t a standard formula for calculating the upper and lower CIs in Excel; however, there is a way you can calculate these by using the Analysis ToolPak add-in.
How to calculate CIs in Excel
Activate the Analysis ToolPak and Solver Add-ins
Firstly, for this method to work, you need to ensure the Analysis ToolPak add-
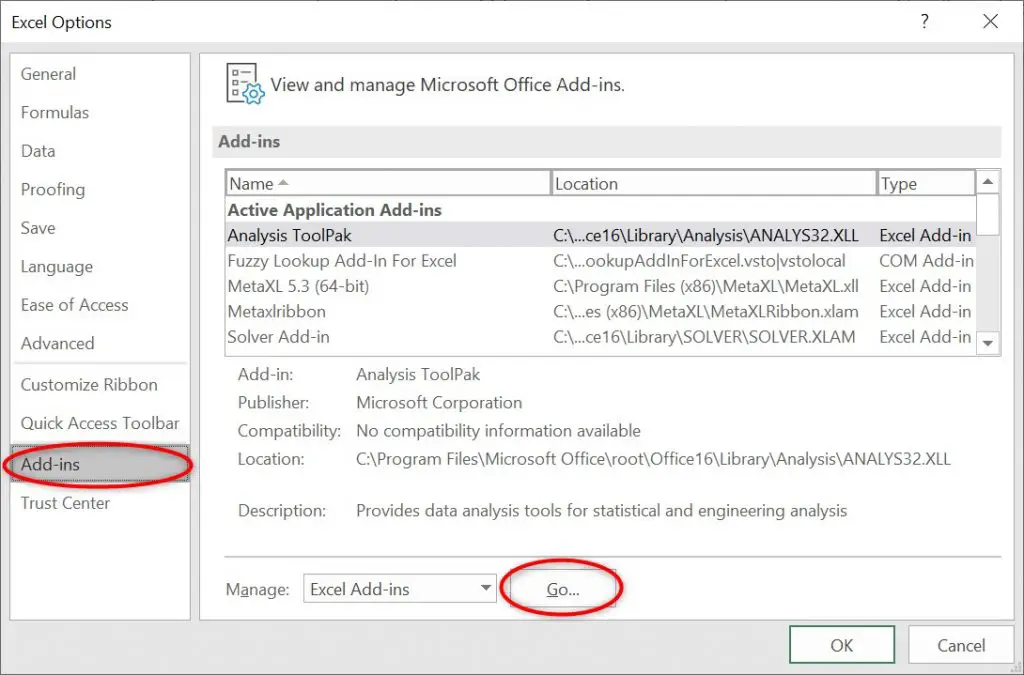
To check this, in Excel go to ‘File>Options‘ and select the ‘Add-ins‘ option in the menu.
At the bottom next to ‘Manage‘, select ‘Excel Add-ins‘ from the dropdown menu and click the ‘Go‘ button.
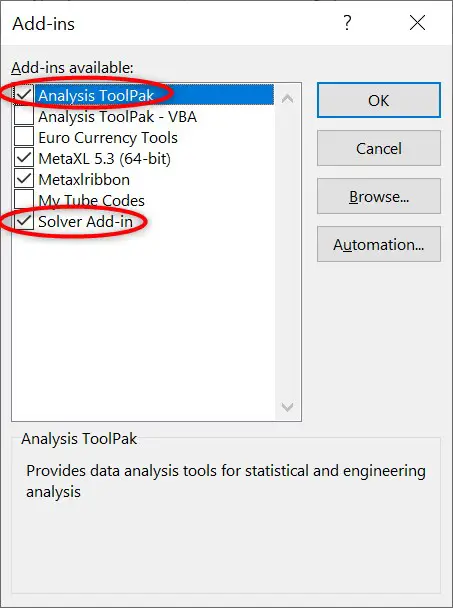
In the new window, ensure that both the ‘Analysis ToolPak‘ and ‘Solver Add-in‘ options are selected and click the ‘OK‘ button.
Now you should have everything you need to go ahead and calculate the 95% CI in Excel.
Calculating the CI in Excel
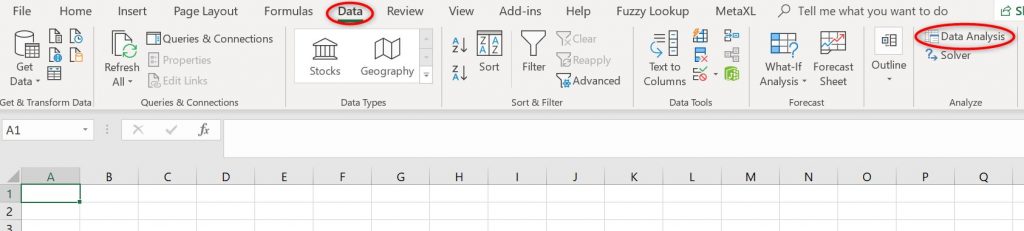
To calculate the CI in Excel, go to the ‘Data‘ tab at the top and select the ‘Data Analysis‘ option in the ribbon.
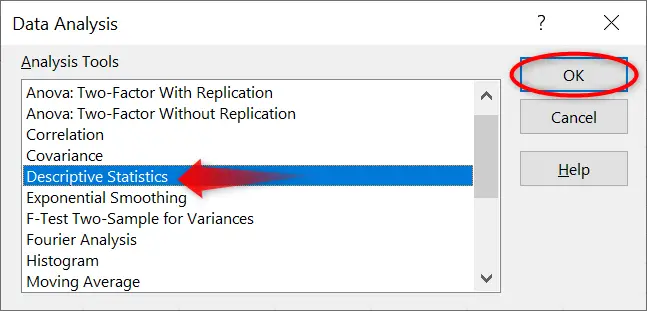
There are a few different analyses that can be performed with this add-in, but the one we want for this tutorial is the ‘descriptive statistics‘ option. Select this, and click the ‘OK’ button.
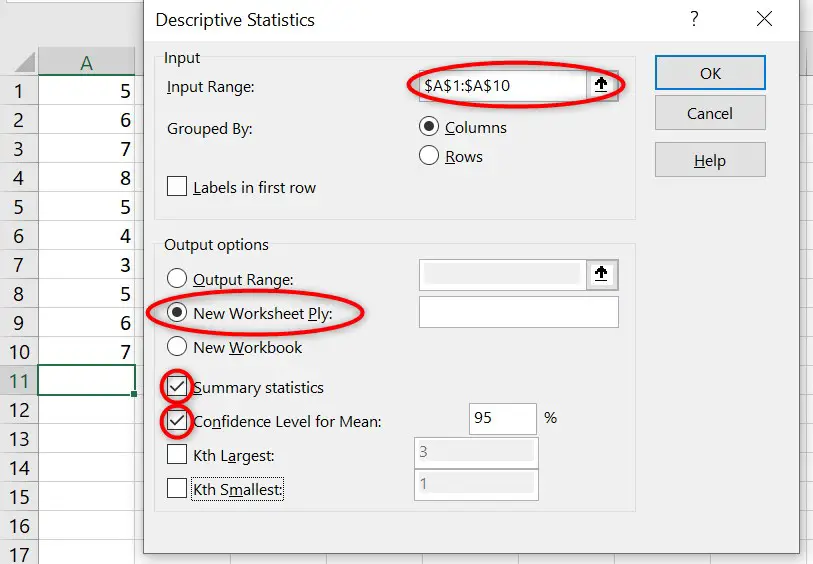
Now you need to fill in the required input and output options. I have explained these options in more detail below.
Input
- Input Range – Use this to select the cells that contain the data you want to calculate the descriptive statistics for.
- Grouped By – Select ‘columns’ if
you data is enteredverically or ‘rows’ if it is horizontal. Additionally, the ‘labels infirst row’ should be selected in the first row in your data contains a header.
Output
- Output Range – Select the cells that you want the results to be entered.
- New Worksheet Ply – Or, the results can be entered into a new worksheet in the same document (recommended).
- New Workbook – Or, the results can be entered into a new document.
- Summary statistics – This will return a lot of statistics about the data, such as the mean and standard deviation. I recommend selecting this.
- Confidence Level for Mean – Select this option and specify the desired confidence level (usually 95%).
- Kth Largest – This will report the Kth largest value in the data set. K is a number you can specify.
- Kth Smallest – This will report the Kth smallest value in the data set.
The output for the descriptive statistics
The results of the descriptive statistics should be entered into a new worksheet in the document. Below is a screenshot for the results in the example.
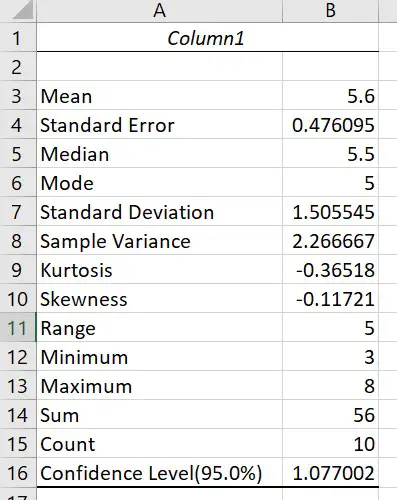
In this example, I asked for the 95% CIs.
Notice that the 95% CI result is only one value; Excel does not return the lower and upper 95% CIs of the mean.
Calculating the lower and upper CIs of the mean
To calculate the lower and upper CIs (95% in this case) of the mean, simply subtract or add the ‘confidence level‘ value from the mean.
So to calculate the lower 95% CI, click on an empy cell and enter the formula below.
=Mean-Confidence Level(95.0%)
- Replace ‘mean‘ with the cell containing the mean value.
- Replace ‘confidence Level(95.0%)‘ with the cell containing the 95% CI value.
By using the data in the example, the formula entered would be ‘=B3-B16‘.
To calculate the upper 95% CI, repeat the same process but this time add the values together.
Conclusion
In this guide, I have explained how you can calculate the lower and upper CIs of the mean by using Excel.
Microsoft Excel version used: 365 ProPlus

")
