A question that I often come across for those who are calculating relative gene expression values in qPCR is, how to go about using this method if there is more than one reference (housekeeping) gene?
There are a few ways to work with multiple reference genes in this instance. One way is to select the single best gene from the numerous ones tested to be used as the reference. This can be done by using a variety of software which can determine the best reference gene to use, such as geNorm (available in Biogazelle’s qbase+ program) or Normfinder (a free Excel add-on).
Assuming the multiple reference genes in question work very well and are not affected by the experimental conditions, it is possible to use them all to determine the relative gene expression levels. This approach was described by Vandesompele and others in 2002 and Hellemans and colleagues in 2007, both published in Genome Biology, which I thoroughly recommend reading.
Mastering qPCR
A video tutorial on qPCR data analysis with multiple reference genes can be found in our Mastering qPCR course.
>>Use code 20QPCR to get 20% off<<
The equation
The equation for using multiple reference genes to calculate the relative gene expression is displayed below.
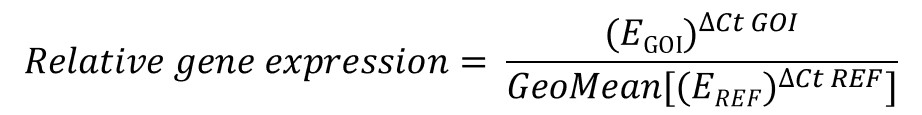 The first thing I will say is: don’t panic! It is actually not as confusing as it looks. It is actually very similar to the Pfaffl equation, the only difference here being the geometric averaging of all the relative quantities (RQ), i.e. the (EREF)∆Ct REF part, of the multiple reference genes used on the denominator (bottom) part of the equation.
The E in the equation refers to the base of exponential amplification. A value of 2, like in the delta-delta Ct method, indicates that after each PCR cycle, the amount of product will double. In other words, a value represents a 100% efficient reaction.
How to use the equation
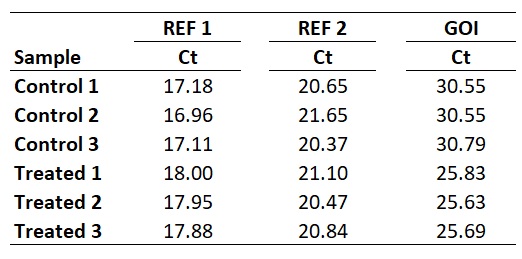
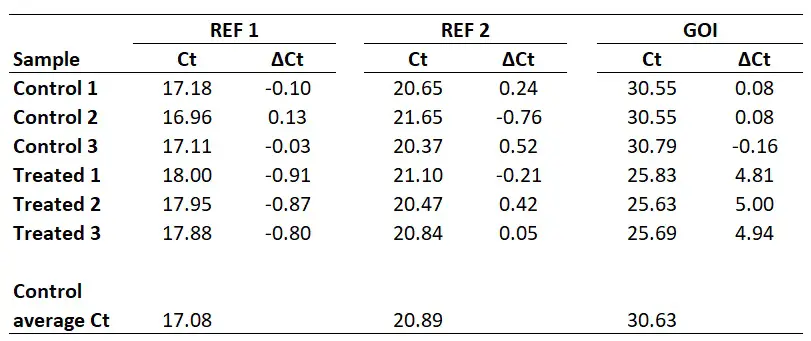
I will start with an example of a qPCR experiment, where I have Ct values for control and treated samples. I have performed qPCR using 2 reference genes (REF 1, REF 2) and my gene of interest (GOI). Each group has 3 biological repeats (1, 2 and 3). This could be a theoretical example of a cell culture experiment which has been repeated three times. Each qPCR was run in duplicate (technical repeats) and an average Ct value calculated, which are presented in the Ct column. The example data is presented below.
1. Calculate primer efficiencies
Like the Pfaffl method, the first thing that is required is to determine the primer efficiencies for your GOI and REF genes, in order to calculate the base of exponential amplification value. How to calculate primer efficiencies has been described in detail previously, so please refer to this post before continuing further.
Once you have the primer efficiencies, these will be in the format of a percentage, for example, 98%. However, this percentage is not entered directly into the equation, rather it needs to be converted.
A converted primer efficiency value of 2 indicates a 100% efficiency. This is the case when using the delta-delta Ct method. In other words, for every PCR cycle, the amount of DNA will multiply by 2. On the other hand, an efficiency of 90% would give a base of exponential amplification value of 1.90 and an efficiency of 110% would give a value of 2.10.
If you are still unsure, an easy way to convert the primer efficiency percentage is to divide the percentage by 100 and add 1.

For this example, I will pretend I have calculated the primer efficiency of my genes as follows:
- GOI = 1.93 (93%)
- REF 1 = 2.01 (101%)
- REF 2 = 1.97 (97%)
2. Select a calibrator sample to determine delta Ct (∆Ct)
The next step is to decide which sample, or group of samples, to use as a calibrator when calculating the ∆Ct values for all the samples. As mentioned previously, this is the part which confuses a lot of people.
A common way of doing this is to just match the experimental samples and determine the relative gene expression ratios separately. This is all well and true for experiments that have matched pairs, such as the case in cell culture experiments. However, this is difficult when the two experimental groups vary in n numbers and do not have matched pairs.
Another way is to select a sample with the highest or lowest GOI Ct value, reflecting the sample with the lowest or highest relative gene expression value respectively. This way, all the results will be relative to this sample.
I personally average the Ct values of the Control group biological replicates to create a ‘Control average Ct’. By doing so would mean that the results are presented relative to the control average Ct values.
Whichever sample, or group of samples, you use as your calibrator is fine so long as this is consistent throughout the analyses and is reported in the results so it is clear. Remember, the results produced at the end are relative gene expression values.
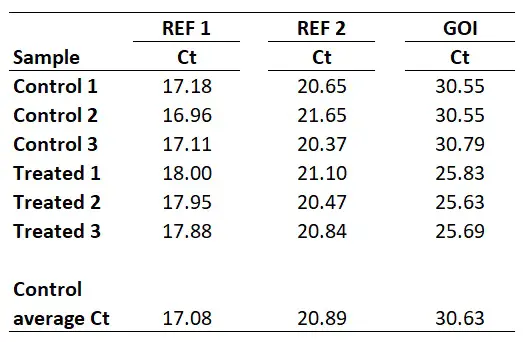
With this in mind, we next need to average the Control group Ct values for each gene.
So, for REF 1 this will be the average of 17.18, 16.96 and 17.11, which works out as 17.08. Repeating this for the REF 2 and GOI will give the following results.
3. Calculate delta Ct (∆Ct) values
Next, we need to calculate ∆Ct for all the samples within the different genes. The equation for ∆Ct can be found below.
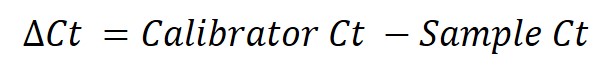
To do this, simply subtract the sample Ct values from the calibrator Ct (in this example this will be the ‘Control average Ct‘ value).
So, to calculate the ∆Ct for the sample ‘Treated 1‘ for REF 2, you need to do 20.89 – 21.10, which equals -0.21. By repeating this for all the samples, for both genes, we get the results below.
4. Calculate relative quantity (RQ) values
The next step is to create RQ values for each sample, separately for each gene. The equation for calculating RQ is displayed below.
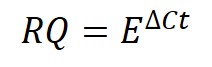 Where E in the equation refers to the base of exponential amplification (i.e. the efficiency of the reaction). Remember, these were calculated for each primer pair used in Step 1 above.
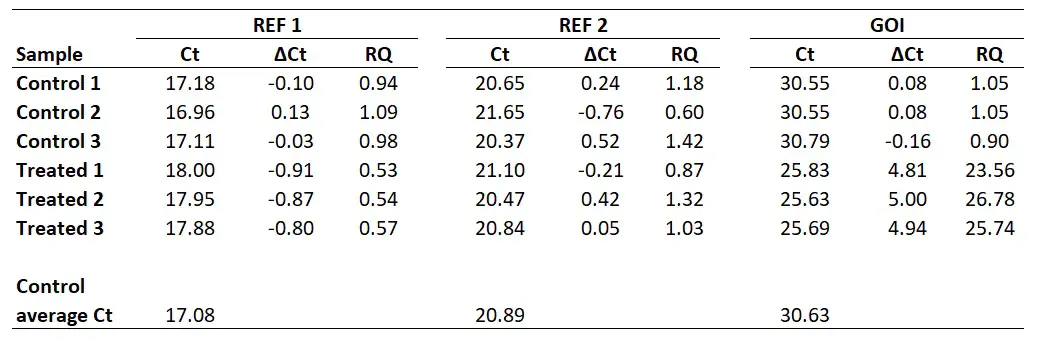
To show you one example, I will calculate the RQ for the Control 1 sample. For the REF 1 gene, I calculated the base of exponential amplification to be 2.01 (i.e. 101% efficiency). So the RQ in this sample will be 2.01-0.10 which comes to 0.99. For the REF 2 gene, I calculated the base of exponential amplification to be 1.97 (i.e. 97% efficiency). So the RQ in this sample will be 1.970.24 which comes to 1.18. And for the GOI, I calculated the base of exponential amplification to be 1.93 (i.e. 93% efficiency). So the RQ in this sample will be 1.930.08 which comes to 1.05. I have extended the results to repeat this analysis for all of the samples.
5. Calculate the geometric mean of the reference genes RQ values
This next step is the part which takes into account multiple reference genes. Specifically, the geometric mean of the reference gene RQ values must be created for each sample used. To do this in Excel, use the ‘=GEOMEAN‘ function.
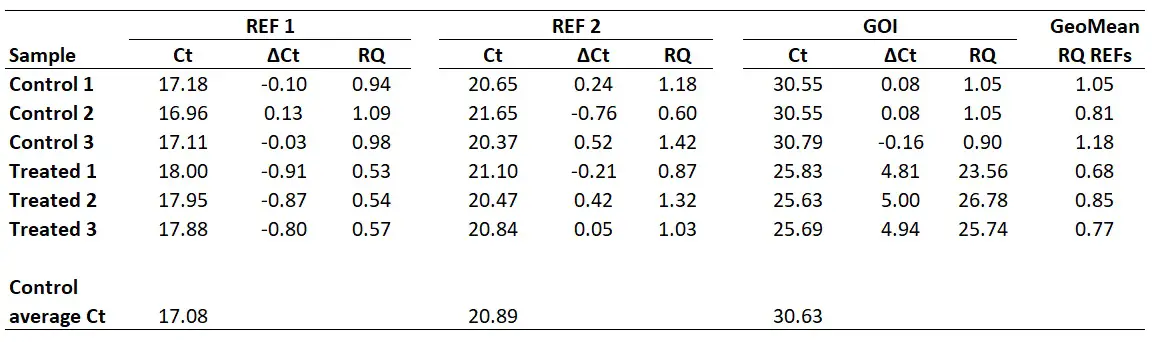
For example, for the ‘Control 1‘ sample, this will be the geometric mean of 0.94 and 1.18. In Excel, the formula will be ‘=GEOMEAN(0.94,1.18)‘. If more reference genes were used in the experiment, then these RQ values can also be added on here too. The geometric mean of the aforementioned calculation gives 1.05.
I have calculated the geometric means of the two reference genes in the example (‘REF 1‘ and ‘REF 2‘) for all the samples below.
6. Calculate relative gene expression values
Finally, we now have all of the components to be able to calculate relative gene expression values. To calculate the relative gene expression values, simply divide the RQ of the GOI by the geometric mean of the RQ values for the reference genes (i.e. that created in the previous step).
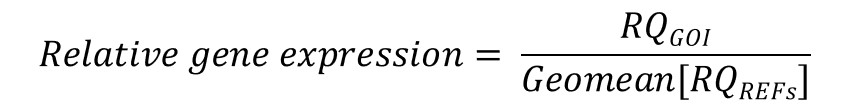 You will notice that this equation is the same one at the start of this article – just a simplified way of writing it.
Taking ‘Treated sample 1‘ as an example, the relative gene expression value will be 23.56 divided by 0.68, which gives 34.81.


Can we not use the average of multiple CT values of multiple genes in the 2 deltaCT method?
Ideally, you shouldn’t do that. If your reference genes have different delta Ct values then simply using the arithmetic mean will not account for the differences in results. This is why this method was created, to account for these variabilities.
I hope that helps,
Steven
Hello Steven
Thats a fantastic explanation. Could you comment on how do you the plot this data. I use 2 power delta ct to show the relative expression of the groups. And also I plot the fold change relative to 1 of control group. In the method you mentioned above, what data do you plot and present?
Thanks.
Hi Praveen,
For the data, I usually log-transform the final gene expression results and then display these results. You could do a log-transformation with the base of 2, for example. This just makes it more presentable (usually).
Thanks,
Steven
Hello Steven
Thanks for the reply. Just another question –
Do you log transform the RQ values of GOI and GEOMEAN Ref Rq?
or
Is the relative gene expression values
I would log transform the final values (the relative gene expression values)
Just a short comment to tell you: MANY THANKS FOR THIS!!! Just starting in the qPCR world, and your easy to follow, to-the-point explanations helped me tremendously. Great job!!! It is nice that someone cares about sharing knowledge and helping others 😀
Hi Alba,
You are very welcome. I am glad you found it useful and thanks again for your kind coffee donation 🙂
Thanks,
Steven
The explanation found here is the most complete and understandable discussion of qPCR data analysis I have ever found. Thank you! I just had a few questions.
What is the official name of the method you have described above? and can it be used with the delta delta CT method or is considered another separate but appropriate method for handling qPCR data, specifically when you want to use multiple reference genes?
Hi Domonique,
Many thanks for your kind comment.
This method doesn’t really have a name, unlike the Delta-Delta Ct method. I refer to it as the Vandesompele method after the lead author on the two papers cited in the introduction. In a manuscript I would state ‘a method described by Vandesompele et al’ and cite their papers.
I would use this method as an alternative to the Delta-Delta Ct method where possible. Mainly, if you have primer efficiency data and multiple reference genes, the Delta-Delta Ct method cannot handle these.
I hope that helps.
Best wishes,
Steven
Thanks for this information! A question:
For this method, a control group average can be calculated and reported/shown, which is not the case for the delta delta Ct method. In the example given, the average of your control group values comes out to be 1. What if it does not?? I’m working with a data set, using your method of analysis, where my control ave turns out to be ~5 and two experimental group averages are ~1 and 3. I can interpret this to mean that my experimental groups are showing reduced expression relative to the control . . . but the values do not intuitively make sense to me.
Hi Sue,
Many thanks for your comment.
To normalise the gene expression levels to the control group average so the control group average value will be ‘1’, make a new column and divide all of the gene expression values for all the samples by the control group average gene expression value. Then average these values for the groups and the control average should now be set to ‘1’.
I hope that makes sense.
Best wishes,
Steven
Hi Steven,
I have found this page very useful – thanks for the great info !
I wonder though if you could help me…
I am currently writing up a report for some work I did in the lab during a short placement…I ran multiple qPCRs without first calculating my primer efficiency (as I didn’t realise at the time this is something I had to do).
I used both GAPDH and BETA ACTIN as my housekeeping genes (HK) but there is some small variation both between each of the HK genes and between samples. I cannot get back to the lab to determine my primer efficiencies therefore I cannot calculate the geometric means of these reference genes.
Therefore, when calculating ΔCTs, would it be best for me to take an average of the housekeeping genes from ALL the different samples on my plate and subtract this from each samples average Ct to get my ΔΔCT (so the same average HK value is subtracted from the average Ct for each different sample) OR would it be better to use the average HK genes for each sample (even though there is some variation)
Sorry if I’ve made this more confusing than necessary !
Erin
Hi Erin,
Many thanks for your comment and sorry for the delay.
If you do not have primer efficiencies then you could use the Vandesompele method and presume all of your experimental genes have an efficiency of 100% (as in the Delta Delta Ct method), by using the amplifcation efficiency of 2. This will then enable you to calculate the geometric mean for the housekeeping genes.
Obviously, this is not ideal since you do not know if your assays are the same (they are probably not), but this will account for multiple housekeeping genes.
I hope that helps.
Best wishes,
Steven
Hello !
Thanks a lot for the clear explanation !
I do have a few questions, though…
I noticed that if I use the same set of data but use them for:
* the usual 2^-∆∆Ct (giving me “fold expression values”) (can I replace 2 by a calculated E value by the way?) OR
* the Pfaffl method OR multiple HKG method (giving me “gene expression ratios” or “relative gene expression”),
I end up with completely different looking graphs !
=> is that normal ?
=> if the answer is yes, is there any way to compare/transform “fold expresion” and “gene expression” values ?
Thanks a lot in advance
Hi Katy
Many thanks for your comments. Below is the answers I can think of for your questions:
1) Yes, you can replace the 2 in the Delta Delta Ct method with a different primer efficiency. However, this will again assume that both the gene of interest and reference (housekeeping) gene have the same amplification factor. If they are different, then this is why the Pfaffl method is preferred.
2) The equations are very similar, however, there can be differences in terms of the output between then. Obviously, since the Pfaffl equation and Vandesompele methods require individual primer efficiencies for both the genes of interest and reference genes then this can affect the outcome.
My question to ask is how different are your primer efficiencies?
Thanks,
Steven
Hello !
Thanks for your quick answer ! Your help is very much appreciated !
I read that people usually pool cDNA together to get a E value but in our case, we tried to keep the samples separated and did serial dilution with each cDNA. What we did with the Delta Delta Ct method was that we averaged the E values for both the CTL and the TEST samples and used this AvgE instead of 2. As for the HKG and GOI E values, well, they are quite similar BUT…
We have worked with different couples of primers in two different cDNA tubes (prepared the same day but based on different bacterial growth conditions) and we consistently have:
1) low efficency values (around 75%)
2) different efficency values (can be +-20%) for the same couples of primers
Why would efficiency values be different for the same couple of primers on different cDNA ???
Could that come from the RT step ? It does not always goes in the same direction, though (in the same experiment, sometimes the E values is higher with cDNA 1, and sometimes it is with cDNA2).
I am really confused…
Hi Katy,
I have replied to these questions on your e-mail.
Thanks,
Steven
Many Thanks for this topic !!!
Before this, it was very difficult to find something complete, precise and clear on the qPCR analysis with 2 reference genes and the integration of efficacity.
Very good job, thx a lot
Hi Cecile,
Many thanks for your comment, I really appreciate it!
All the best with your research.
Steven
Hi Steven,
How would this work if each group had 1 set of biological samples?
Hi Rob,
Many thanks for your message.
So you have experimental groups with just 1 biologcal sample in each group? I would not recommend this. More biological samples are required, especially for statistical analyses.
However, even if there was 1 sample in each group, the same process would apply. The calibrator sample can be the sole control sample. Then everything else is compared to that.
Hope that makes sense.
Steven
May there be a mistake with the primer efficiency calculation?
if 100% efficiency for a pair of primers means the template would be increased by a factor of 2 than if you have 110% efficiency the amount of template would be increased by a factor of 2.2 and not 2.1.
Hi Uri,
Many thanks for your comment.
I understand your confusion. The amplification factor (E) of 2 represents a primer efficiency of 100%. To calculate the amplification factor, the equation of: 10^(-1/slope) is used. Where the slope is the slope of the line following the serial dilutions of a qPCR series. A slope of -3.1 gives an amplification factor of 2.1 and a primer efficiency of 110%.
I have just created a qPCR primer efficiency online calculator which does this for you. All you have to do is to enter the slope value.
I hope that helps!
Steven