In this tutorial, I will demonstrate how to calculate the variance in Microsoft Excel. Specifically, I will show you how to calculate the variance of a sample, as well as a population.
What is variance?
To begin with, let me quickly explain what the variance is.
Variance is a measure of variability.
Simply, it is calculated by taking the average of squared deviations from the mean. The resulting value, known as variance, tells you the degree of spread in your data.
The larger the variance value, the more spread the data is in relation to the mean.
How to calculate variance in Excel
Calculating the variance in Excel will differ slightly depending on whether you want to calculate the variance for a sample or a population.
Calculating variance of a sample
I’ll start by calculating the variance for a sample, which is probably what most people are interested in.
In my Excel sheet, I have some example data.
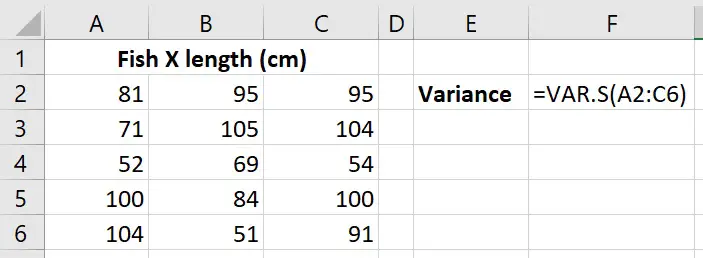
Let’s say I am interested in a rare fish called Fish X. What I’ve done is take a sample of 15 Fish X fishes and measured their length in centimetres.
To calculate the variance of a sample in Excel, use the VAR.S function.
=VAR.S(number1, [number2], ...)
Within the parenthesis, add in the cells containing your data.
Here is what my formula looks like for the Fish X example.
The variance for my sample is 389.924.
The units for the variance are the same as the original measurement squared; so my variance is in fact 389.924 cm2.
[Optional] Calculating the standard deviation from the variance in Excel
If you’re wondering, you can calculate the standard deviation from the variance by simply square rooting the variance. You do this by using the SQRT function.
=SQRT(number)
- number – Replace this with the cell containing the variance value
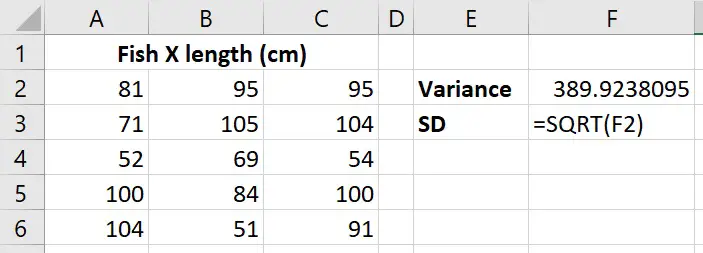
The standard deviation comes out to be 19.7465.
The units for this will be the same as the original units for my data, so this would be centimetres.
Calculating variance of a population
I’ve got a different dataset now. This time, I have the data for all the Fish X fishes in the world; in total there are 100. So, what I have here is known as a population.
Calculating the variance of a population involves a slightly different function compared with the sample variance. This time, we will use the VAR.P function.
=VAR.P(number1, [number2], ...)
Again, within the parenthesis, add in the range of cells containing your data.
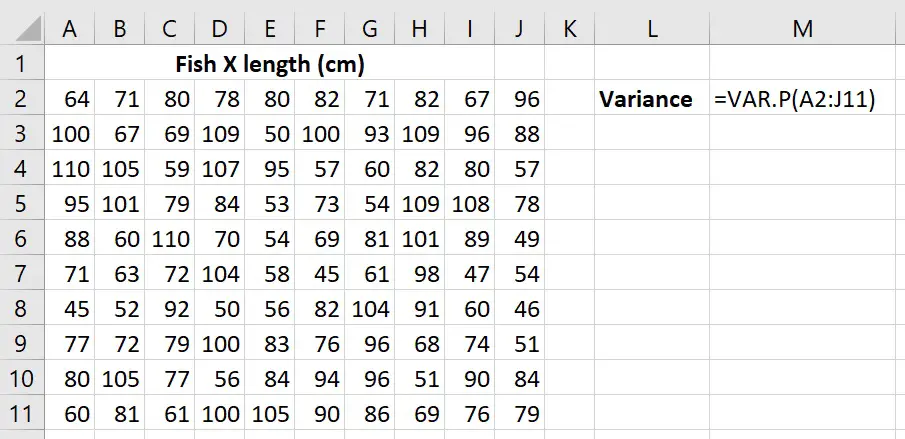
I get a result of 341.12.
Again, this will have the units cm2.
How to calculate variance in Excel: Wrapping up
Now you know how to calcuate the sample and population variance in Microsoft Excel.
To calculate the sample variance, use the VAR.S function. If you’re wanting to calculate the variance of a population, then use the VAR.P function instead.
Microsoft Excel version used: 365 ProPlus

")
