In this tutorial, I will show you how to calculate Cohen’s d in Microsoft Excel.
What is Cohen’s d?
Cohen’s d is an effect size between two means. More, specifically, it is a standardized value that indicates the difference between two means in the number of standard deviations (SDs).
What is required to calculate Cohen’s d?
To calculate Cohen’s d between two means you obviously need two groups of data.
For each group, you generally need to know the mean and SD of each group.
But, in this tutorial, we will calculate Cohen’s d by using a variant of the equation that takes into account the number of values in each group (n). This formula is termed Cohen’s ds.
To understand the different Cohen’s d formula, have a look at the what is Cohen’s d post.
How to calculate Cohen’s d in Excel
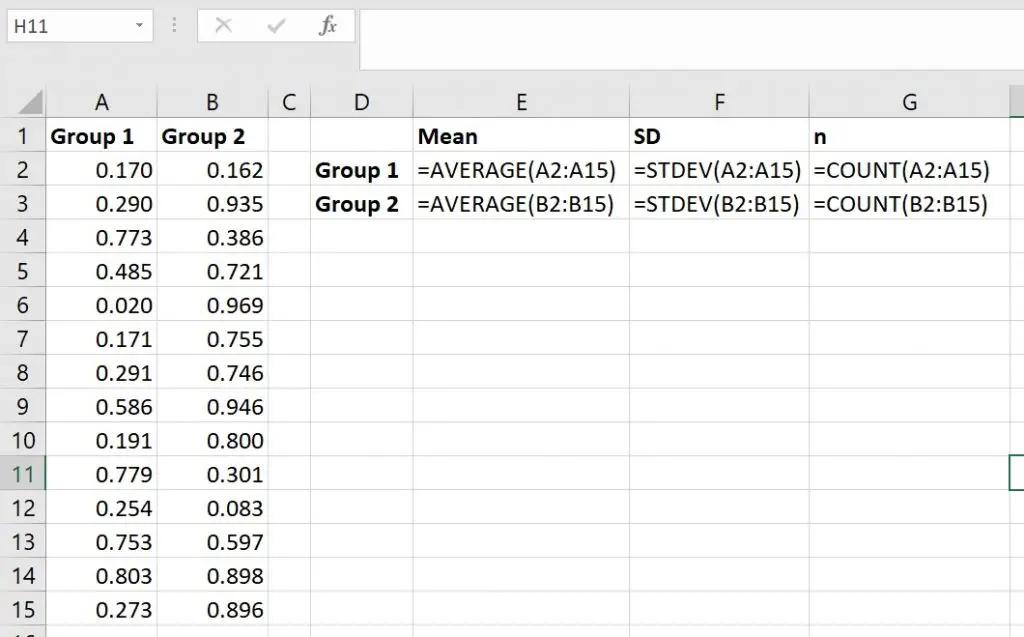
1. Calculate the mean, SD and n
Before you can use the Cohen’s d formula, you need to calculate the mean, SD and n for each of the groups.
Mean
To calculate the mean, in a new cell, enter the following formula.
=AVERAGE(number1)
Replace number1 with the range of cells containing the data.
SD
To calculate the SD, use the STDEV formula in Excel in a new cell.
=STDEV(number1)
Again, replace number1 with the range of cells containing the data.
n
To work out the number of values in each data set, you can either manually count them or use the COUNT formula in a new cell to get Excel to do it for you.
=COUNT(value1)
Replace value1 in the formula with the range of cells containing the data.
Here are the completed formulas when using my example data.
2. Calculate the difference between the means
Now we can start working out Cohen’s ds. Firstly, work out the difference between the two mean values.
In a new cell, enter the following.
=Mean1-Mean2
Replace Mean1 with the cell containing the mean value for the first group and similarly, replace Mean2 with the cell containing the mean value for the second group.
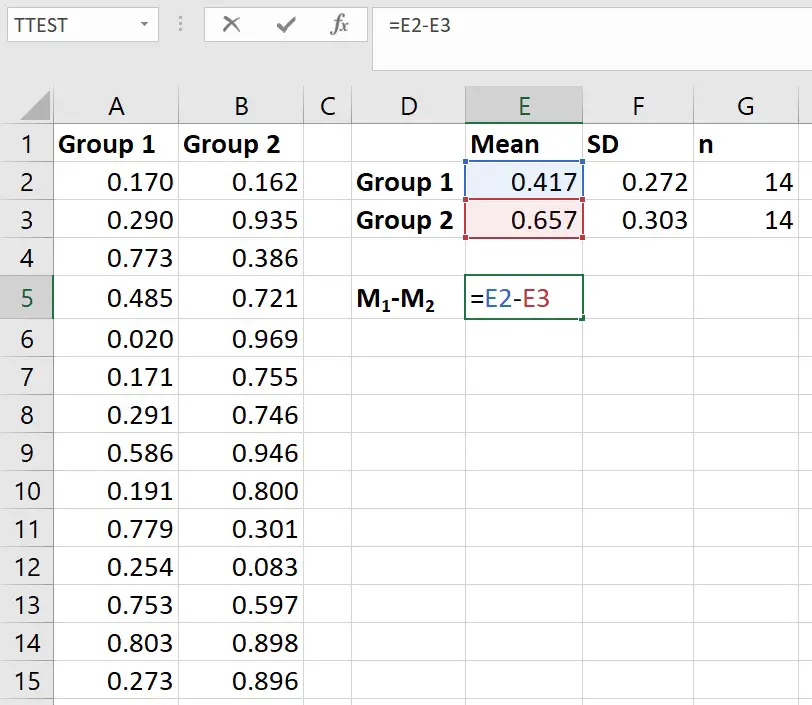
The difference between the means for my data was -0.24.
3. Calculate the pooled SD
Next, we need to calculate the pooled SD. I have described the formula, including the pooled SD, involved in calculating Cohen’s d before.
In a new cell, enter the following formula.
=SQRT(((n1-1)*SD1^2+(n2-1)*SD2^2)/(n1+n2-2))
Replace the following components with…
- SD1 – The cell containing the SD of group 1
- SD2 – The cell containing the SD of group 2
- n1 – The cell containing the n of group 1
- n2 – The cell containing the n of group 2
The screenshot below shows the completed formula by using my example data.
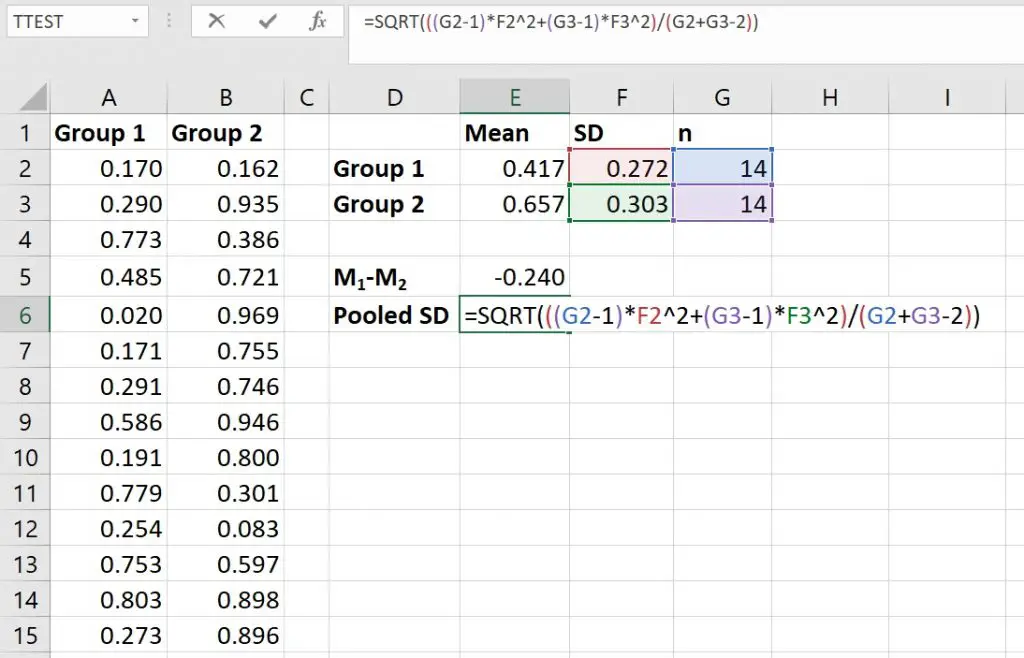
The pooled SD for my data was 0.29.
4. Calculate Cohen’s ds
Finally, to calculate Cohen’s ds, simply divide the value for the difference between the group means by the pooled SD.
To do this, in a new cell, enter the following formula.
=Mean difference/Pooled SD
Replace the Mean difference in the formula with the cell containing the corresponding value; additionally, replace Pooled SD with the appropriate cell.
Here is what it looked like with my data.
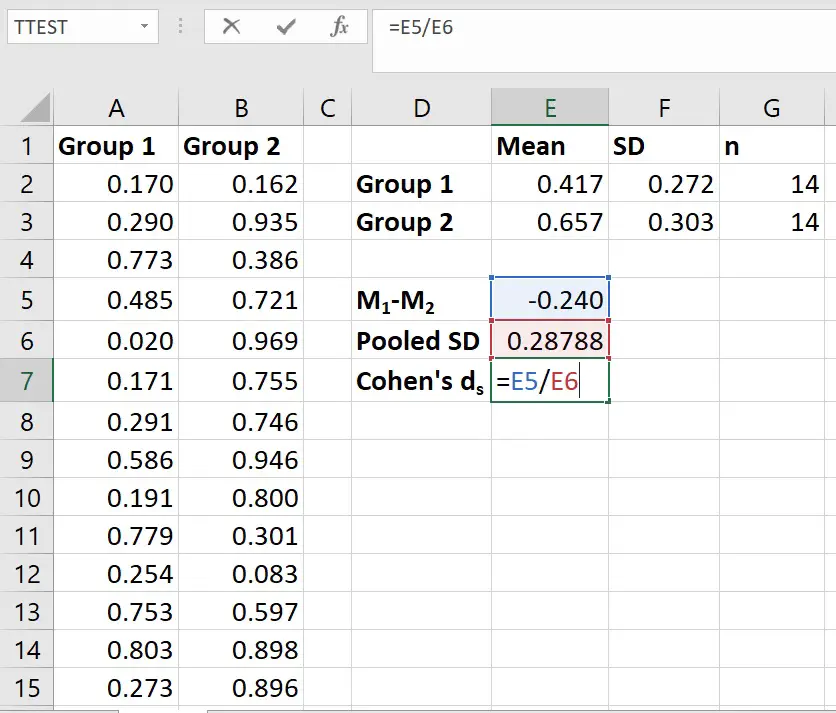
The Cohen’s d for my data was -0.83.
Note, if you get a negative Cohen’s d value, this is simply because the mean for the second group is larger than the mean from the first group. The effect size will remain the same regardless of the order the means are entered into the equation.
This is just something to keep in mind when reporting your results.
Summing up
So, in this tutorial, you have learnt how to calculate Cohen’s d in Excel.
Specifically, this approach calculates Cohen’s d between two group means. To do this, you need to know the mean, SD and n of each group.
Microsoft Excel version used: 365 ProPlus

")
