In this RevMan tutorial, I will explain how to set-up a new file and how to go about entering study data to be able to perform a meta-analysis.
Downloading RevMan
To install RevMan, visit the Cochrane Community website by clicking here and download the latest version of the program. Follow the installation wizard to finish the setup.
The example
In the guide below, I will use an example dataset I created. For this analysis, I am interested in the difference in concentrations of a protein in the blood between young and old adults. I included studies which measured this protein in the blood and reported the mean, standard deviation (SD) and the total number of subjects in each group for the young and old adults.
Creating a new review
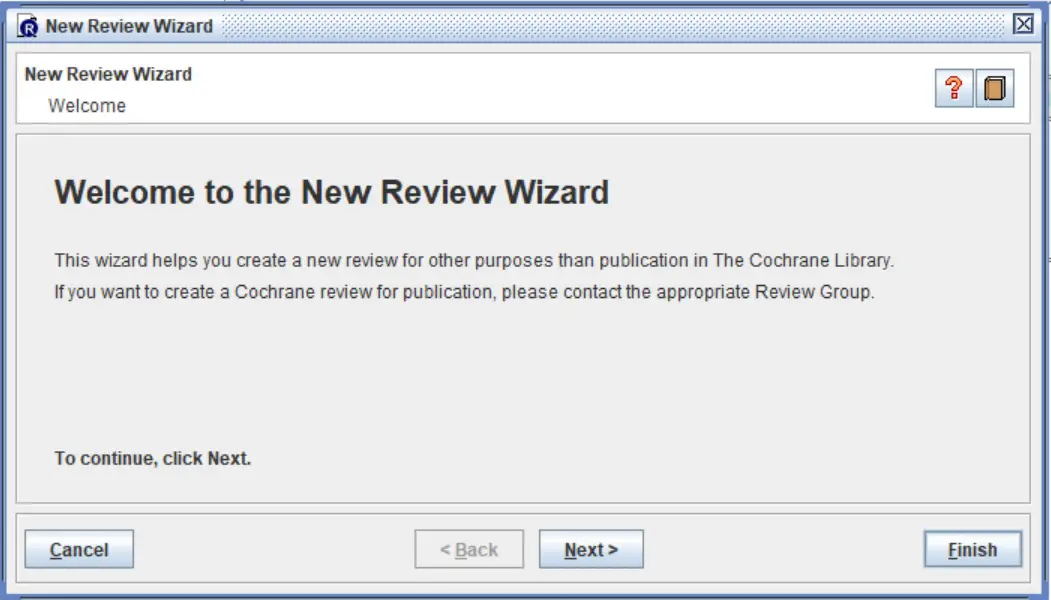
When you first open RevMan, a ‘New Review Wizard‘ will open prompting you to define a new review. I personally do not perform this wizard, but instead, click the ‘Finish‘ button to open up the new sheet.
 With the new file open, the next thing you want to do is to start entering the studies you are going to include in your meta-analysis.
Adding new references to the file
To insert studies to the file, which will be included in the analysis, follow the steps below.
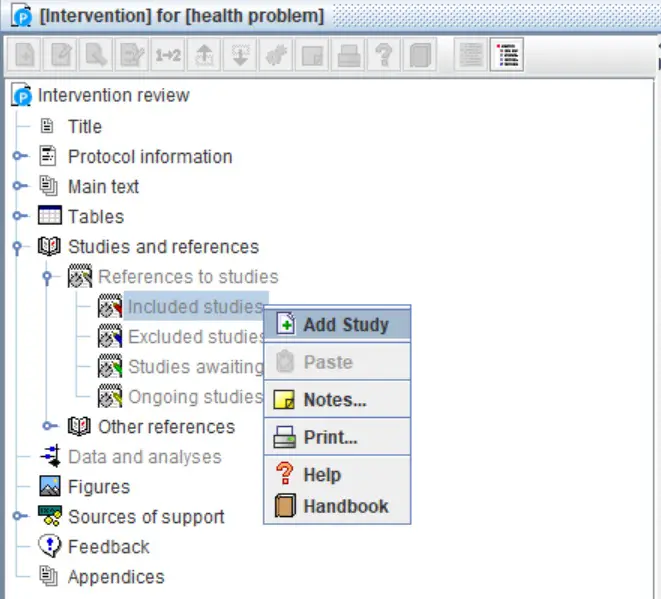
1. On the left-hand tree view, find the ‘Studies and references‘ tab and click the drop-down icon next to this. You should then see a new tab called ‘References to studies‘, click the drop-down icon next to this. You should now see the ‘Included studies‘, ‘Excluded studies‘, ‘Studies awaiting classification‘, and ‘Ongoing studies‘ options.
2. Next, right-click on the ‘Included studies‘ option and select ‘Add study‘.
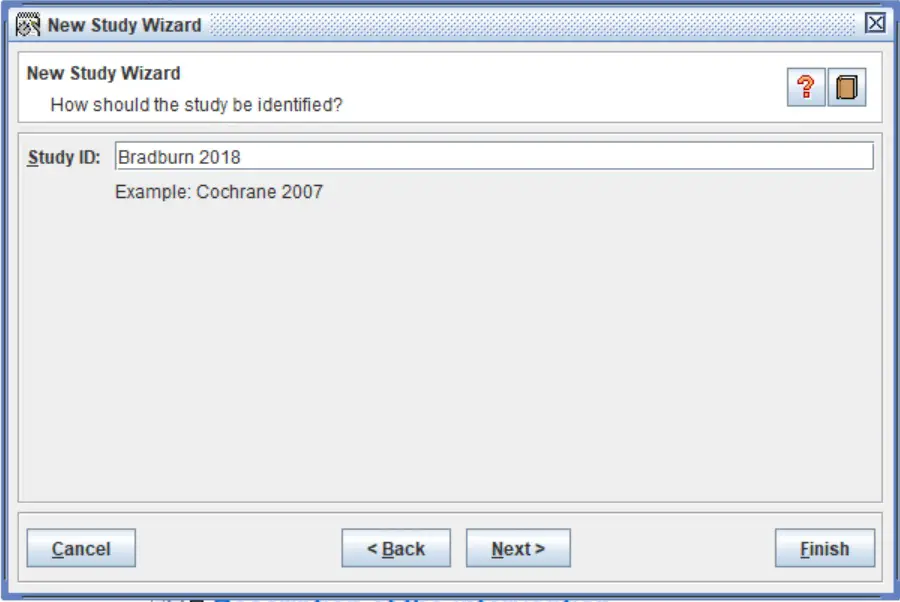
 3. The ‘New Study Wizard‘ should now open. In the ‘Study ID‘ box, enter the first author name of the reference you want to add followed by the year of publication. For example, ‘Bradburn 2018’. Then, click the ‘Next‘ button.
 4. Leave the ‘Data Source‘ option as ‘Published data only (unpublished not sought)‘ and click the ‘Next‘ button.
5. The publication year should already be detected for you. If not, enter the correct year in the ‘Year‘ box. Then, click the ‘Next‘ button.
6. You can leave the next window regarding the identifiers as default and click the ‘Next‘ button again.
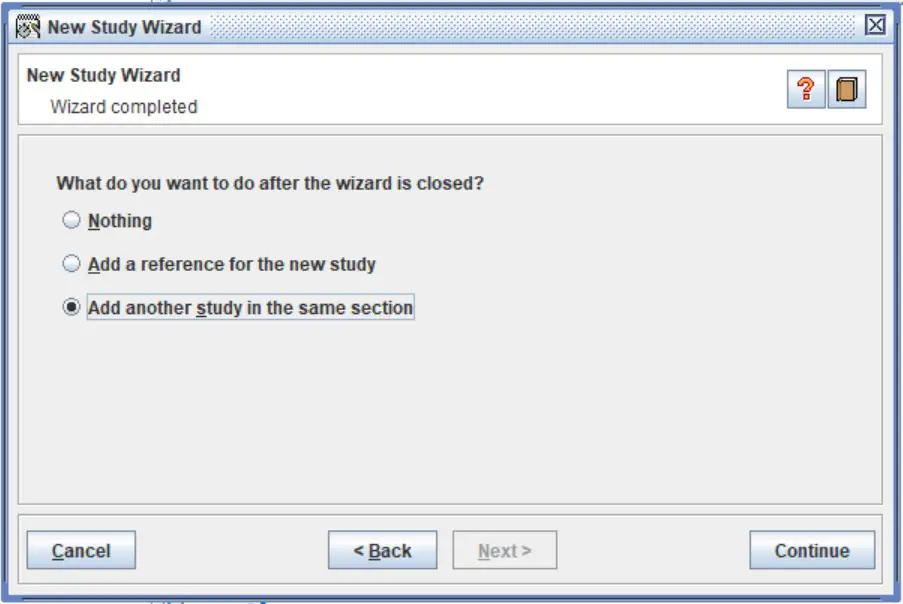
7. Finally, RevMan will ask you what you want to do once you close the wizard. Go ahead and select the ‘Add another study in the same section‘ option and click the ‘Continue‘ button.
Now go ahead and repeat the above process until you have added all of the included study references to the file.
 Once you have finished, you will then see the list of included studies under the ‘Included studies‘ tab on the tree on the left-hand side.
Create a new comparison and outcome
To be able to enter individual data for your studies, you next need to create a new comparison and outcome.
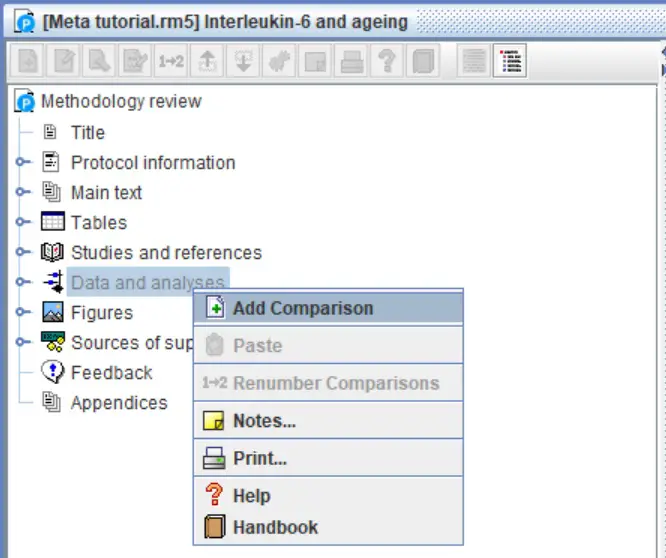
- In the tree, find the ‘Data and analyses‘ tab and right-click it. Then, select the ‘Add comparison‘ option.
 2. In the new window, give the comparison a name in the ‘Name‘ box. Then click the ‘Next‘ button.
3. When asked what you want to do after the wizard is closed, select the ‘Add an outcome under the new comparison‘ option. Then click the ‘Continue‘ button.
4. The ‘New Outcome Wizard‘ option should now open. It is here you need to tell RevMan what type of data will be entered into your meta-analysis. There are 5 options for this.
- Dichotomous – This is where you will enter the total number of subjects and the events occurred in the control and experimental groups. For example, the number of people who were diagnosed with cancer on a placebo and an experimental drug.
- Continuous – For this, your data will be the mean and standard deviation (SD) of a variable on a continuous scale. For example, the concentration (mean, SD and n number) of a certain protein in the blood between control and diseased subjects.
- O-E and Variance – This option is selected when including studies reporting survival analysis data.
- Generic Inverse Variance – Here you can enter the effect estimate, and standard error, of your choice. For example, if you need to enter odds ratio values which have been calculated using adjusted models.
- Other Data – This is where you will enter results as text and these will be displayed in a table.
For this example, I will select the ‘Continuous‘ option. Once you have decided upon the correct data type for your analysis, click the ‘Next‘ button.
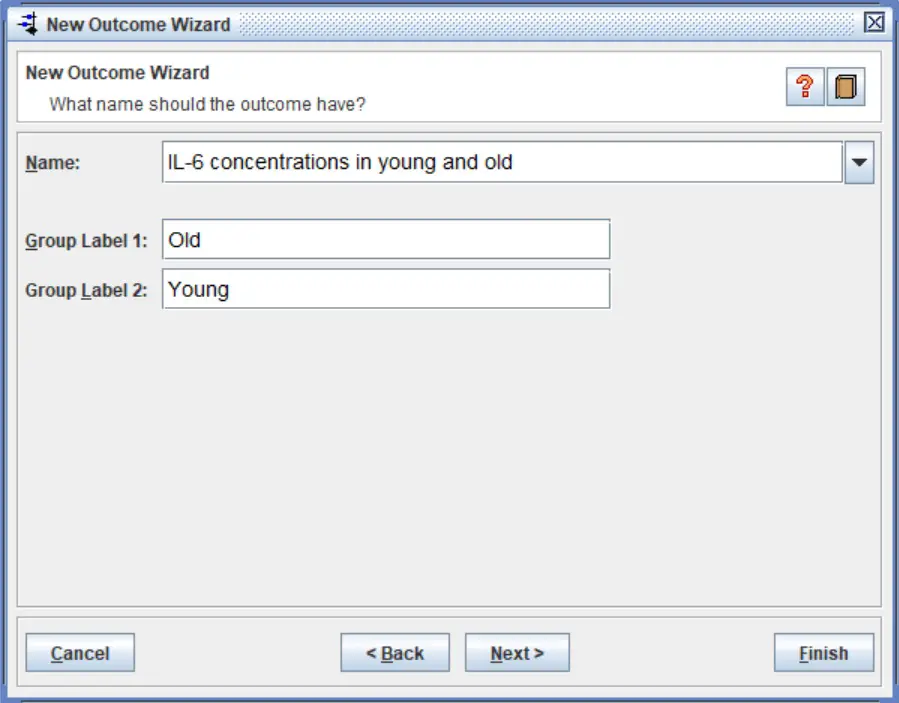
 5. Next, give your outcome a name by filling out the ‘Name‘ box. Underneath this, you also have the option to define the groups in the analysis by changing the ‘Group Labels‘. Once done, click the ‘Next‘ button.
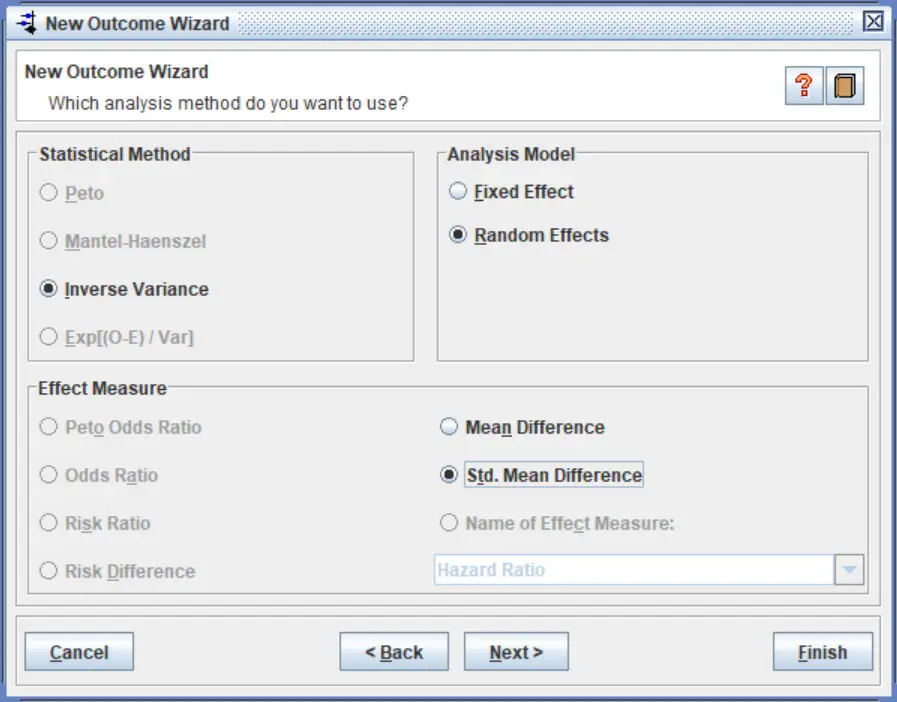
 6. In the next window, you have the option to select the statistical method, analysis model and effect measure used in the analysis. This window will look slightly different, depending upon what data type you have selected.
For this example, I am going to select a ‘Random Effects‘ model in the ‘Analysis Model‘ window. When including studies that vary from each other, which is usually the case, it is recommended to use this option.
For the effect measure, I will select the ‘Standardised Mean Difference‘ option. This option is selected when studies have reported the same outcome, but have measured the effect in slightly different ways. If all of the included studies had measured protein levels in the blood using the same technique and measured on the same scale, for example, then the ‘Mean Difference‘ can be selected.
 Once you have selected your analysis methods, click the ‘Next‘ button.
7. I always leave the next window as the default settings. You can change the confidence levels here if you so wish. Then click the ‘Next‘ button.
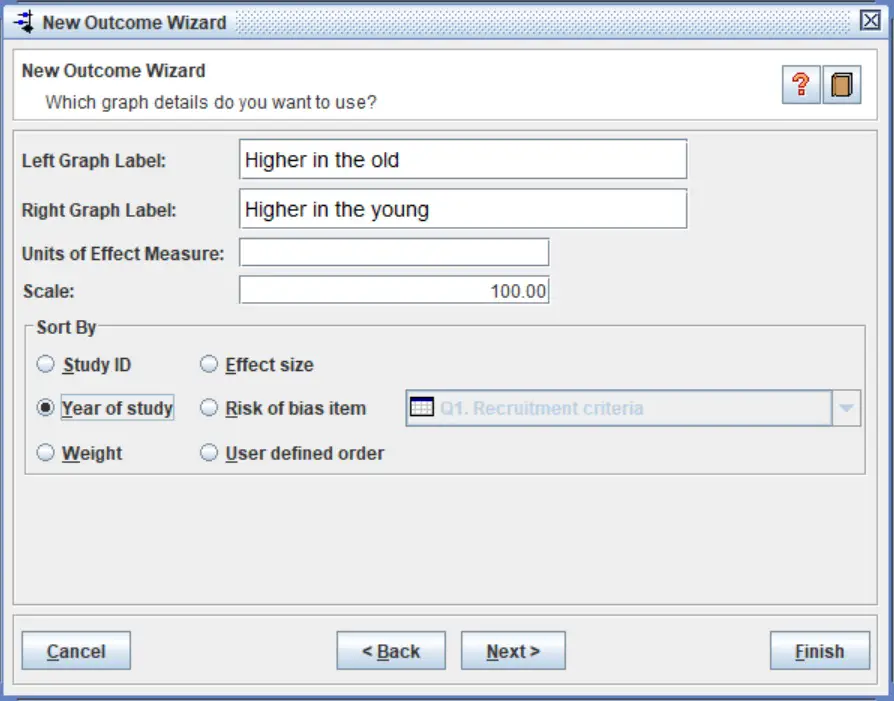
8. In the next window, you will be asked to add more information about the comparison which will be added to the forest plot. You can leave these as default if you want, as these can be edited afterwards.
There is also an option to add in the units for the effect measure. So if all of the studies measured something on the same scale, you can add in these units. Since this example is using standardised values, there are no units.
You can also ignore the scale option, as this can be easily changed when you view your forest plot to a value that best fits the majority of studies on the plot.
Finally, there is an option to sort the studies by different factors. A common choice here is to sort by the ‘Year of study‘.
The image below shows my settings for the example I have used.
 Once finished, click the ‘Next‘ button.
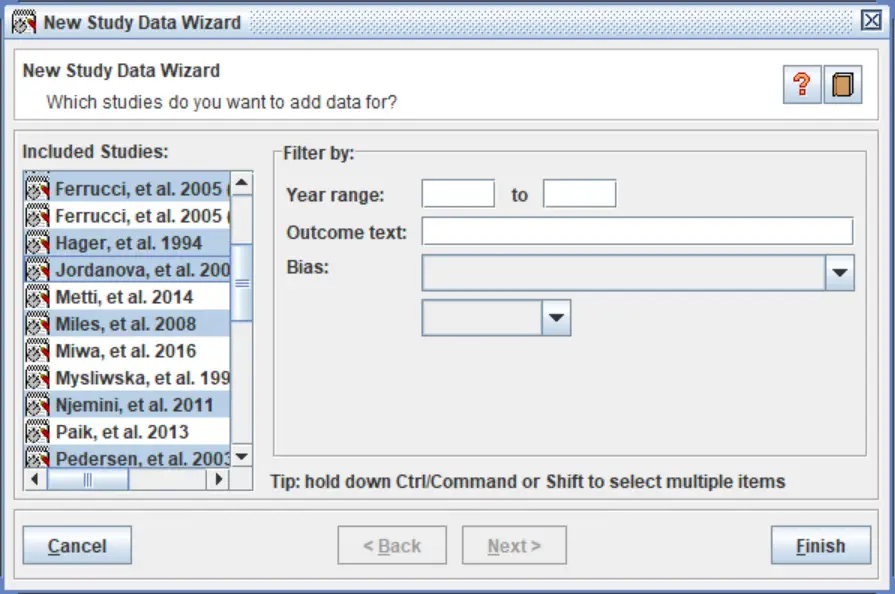
9. Finally, select the ‘Add study data for the new outcome‘ option and click the ‘Continue‘ button. This will open a new window called ‘New Study Data Wizard‘.
10. Now it is time to start adding the included studies to the analysis which will then allow the input of study-specific data into the sheet.
With the ‘New Study Data Wizard‘ still open, select the studies from the list that you want to include in the analysis. To select multiple studies at the same time, hold down the ‘ctrl‘ button on your keyboard while you click. Then click the ‘Finish‘ button.
 Entering data into the new outcome
Now the setup is complete, it is now possible to enter data into the sheet for the outcome. To explain this better, I have entered some example data into a sheet to demonstrate the different parts of the window. Each component is numbered in the image below and described in more detail.
Remember, this example is using the continuous data type, so your sheet may look slightly different to this.
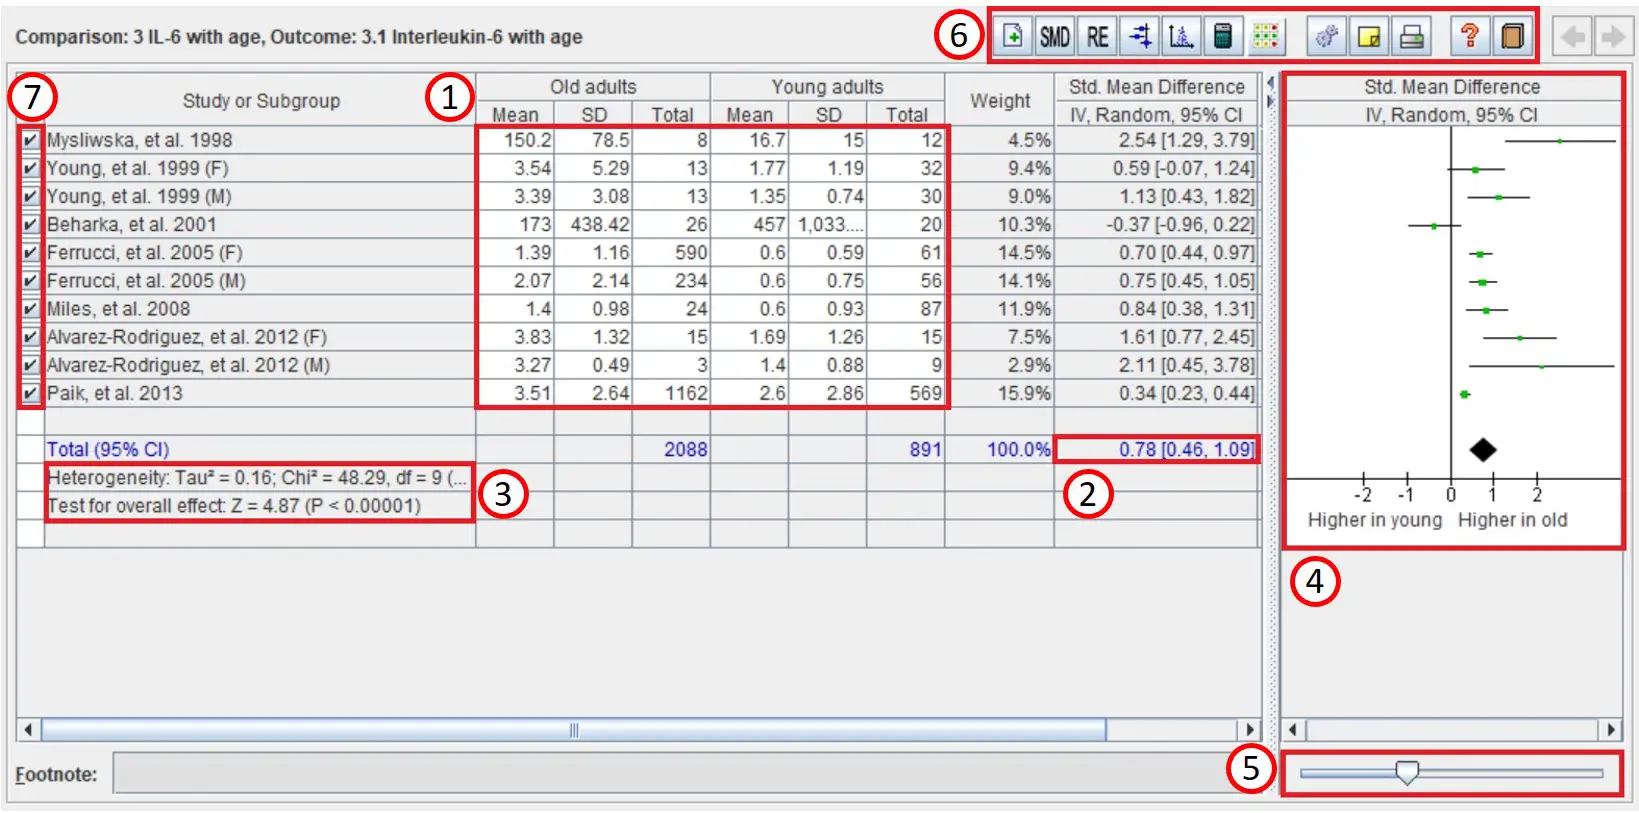 1. Data input – In these white boxes, you can enter the mean, SD and total number (n) for each group in your comparison (or the other effect size of interest in your analysis). After you do this, the results and forest plot will be automatically updated to reflect these changes.
2. Overall effect value – This is the combined effect value from the analysis, including the 95% confidence intervals.
3. Overall effect statistics – This includes information about the statistical tests, including the heterogeneity test and the overall effect P value.
4. Forest plot – The forest plot is a graphical representation of the data from the included studies. You can learn more about forest plots in this detailed article here.
5. Scale slider – This slider can be used to change the scale on the forest plot, for example zooming in or out, to visualise the results of the studies better.
6. Additional options – From here you can add more studies to the outcome, change the analysis model (random- or fixed-effects), view the forest plot in a separate window, view the funnel plot, calculate effects and change the settings of the analysis.
7. Inclusion checklist – Here you can remove studies from the analysis by unticking them. This is a useful feature when you want to perform a subgroup analysis.
What next?
There are a few more routes to go down once you get your meta-analysis up and running. You can find additional guides for RevMan in the list below.
Conclusion
In this RevMan tutorial, I have explained how to go about setting up a new file and entering data to perform a meta-analysis. This should provide you with the basics, which you can tweak to suit your analysis.
RevMan version used: 5.3


Hi,
thank you for very good tutorial how to us Rev – Man for meta analyses
in simple and user friendly way.
whit the best regards
Thank you for the crystal clear tutorial. However, I’m still a bit confused. If I wanted to import study data from RIS format, I will need to enter the data manually or RevMan can automatically fill the data? thank you
Thanks!
As far as I am aware, you have to enter data manually into RevMan.
Hope that helps,
Steven
thanks for the good tutorial on how o do meta-analysis using Review Manager. it was really great, but I honestly never got what I was hopping to understand. I want to know orderly steps involving in calculating pooled prevalence rate using Review Manager. I have read lot of papers and watch lot of videos but nothing point out to prevalence calculation using review manager. the example you demonstrated is exact same example in all other video. I am appealing to you to please help me list the steps involve in doing pooled prevalence analysis using Review Manager. if you can do one video on prevalence calculation it will be really helpful, not just for me but for more people.
Hi Prince
I am currently away for a few weeks so I am unable to create new videos.
But, I did find an article on ResearchGate that may help. Maybe look at the answer by Sumedha Dharmarajan.
https://www.researchgate.net/post/How_to_calculate_pooled_prevalence_using_RevMan
I hope that helps?
Steven