In this tutorial, I will show you how to create subgroups in a RevMan sheet which will be useful when performing subgroup analysis in a meta-analysis.
This follows on from the guide to setting up and entering data into RevMan.
Why perform subgroup analyses?
Subgroup analysis is a useful way of investigating heterogeneous results in a meta-analysis. Specifically, studies can be split into separate groups based on a common factor. For example, comparing studies that involved only females and only males, or comparing studies which measured the effect estimate using method X and method Y.
Example data
In this guide, I will use the same example dataset as the previous entering data into RevMan article.
Specifically, I have 10 included studies which have measured the concentration of a protein in the blood of young and old adults. For the subgroup analysis, I want to see if the overall effect is different in those studies containing only females and only males. In other words, does the meta-analysis suggest there may be a sex effect?
Creating subgroups in RevMan
To create subgroups in RevMan, simply follow the steps below.
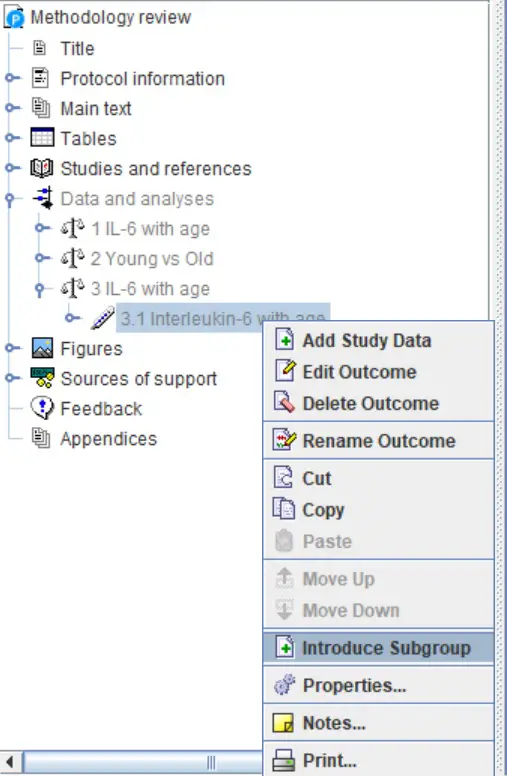
1. In the tree view on the left-hand side, highlight the outcome and right-click it. Then, select the ‘Introduce Subgroup‘ option.
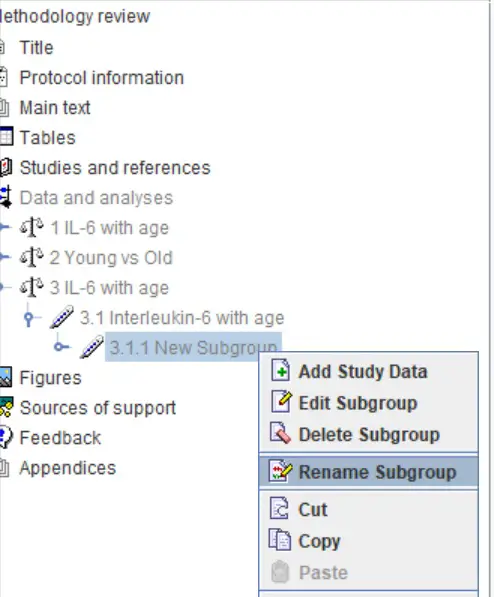
 2. A new subgroup should now be included below the outcome in the tree view. Since only one subgroup is present, all of the included studies in the outcome will now be under this new subgroup.
You can rename this by right-clicking on the new name and selecting the ‘Rename Subgroup‘ option.
 3. To add more subgroups, click on the outcome name again and right-click. This time, select the ‘Add Subgroup‘ option. You can also rename this subgroup by repeating step 2 above.
4. Now, by using the tree view, you can click-drag the included studies into the correct subgroup. Thus, organise the studies by their corresponding subgroup.
In my example, I will now sort the studies into sex-specific groups.
The output
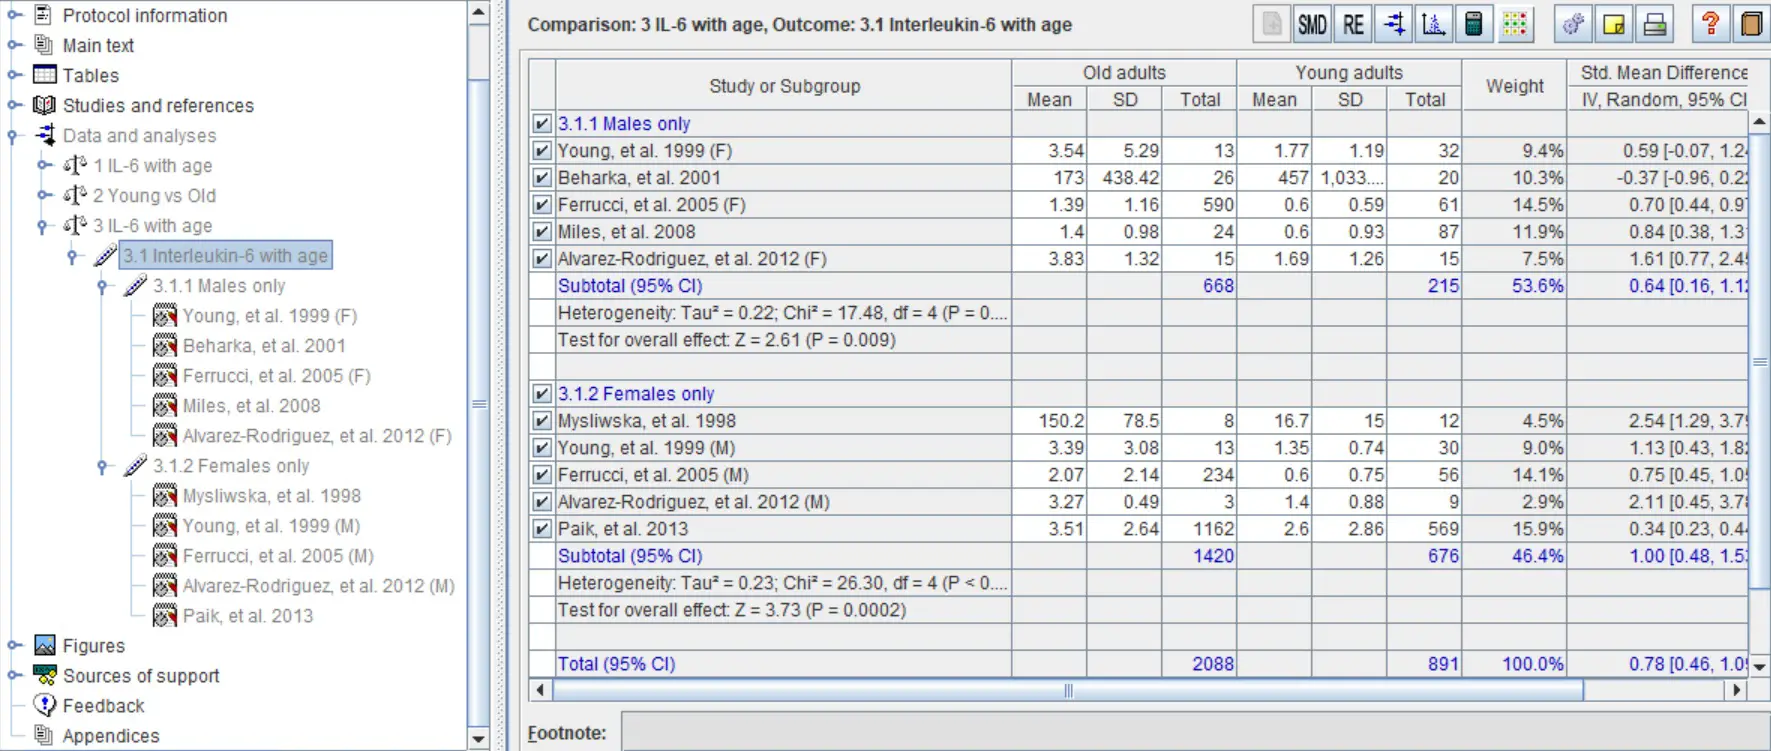
After subgrouping, the datasheet will also be split into separate components. Now, instead of getting one overall effect score, there is also separate results for each subgroup. The overall effect score can also be found at the bottom.
The image below shows what the datasheet now looks like after subgrouping the example data.
These results are also reflected in the forest plot.
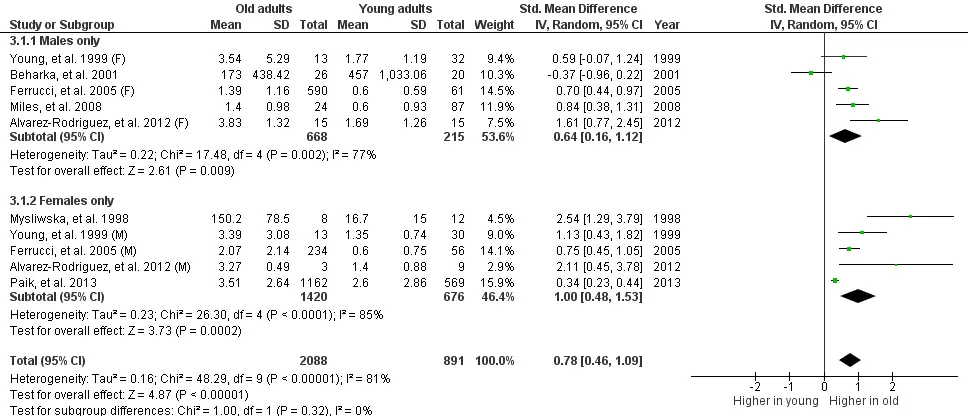
By looking under each subgroup in the forest plot, you will find subgroup-specific statistics, including heterogeneity and overall effect P values.
By looking at the example above, the overall effect for studies containing males only was ‘P = 0.009‘, meaning there is a significant effect in this model. There was, however, a high degree of study heterogeneity in this subgroup (I2 = 77%, P < 0.0001). Similarly, by looking at the female only subgroup, the overall effect was ‘P = 0.0002‘, which is also significant. Again, this subgroup also had a high amount of study heterogeneity (I2 = 85%, P < 0.0001). Therefore, the overall effects are the same regardless of the sex of the population used.
Also, notice that there is a new statistical output found in the lower left-hand corner. This is the test for subgroup differences. In other words, is there a statistical difference between the effects of the subgroups? In the example, the P value for this test is ‘0.032‘, indicating that the effects of the two subgroups are not different from one another. There was also no heterogeneity between the subgroups since the I2 value was ‘0%‘.
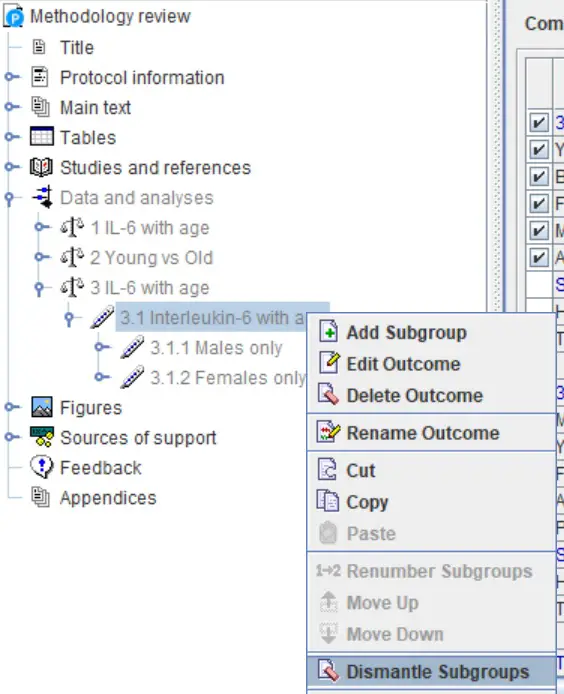
Removing subgroups
If you want to remove the subgroups from the analysis and merge them all back together, simply right-click the outcome in the tree on the left-hand window and select the ‘Dismantle Subgroups‘ option. The studies will then be mixed into one outcome again.
Conclusion
In this guide, I have demonstrated how to go about creating subgroups in RevMan. Subgroup analysis is useful when you want to investigate heterogeneity between studies.
RevMan version used: 5.3


Thank you for your wonderful videos on how to use Revman! Your article on how to interpret Forest plot is very informative as well.
Hi Rachel,
Many thanks for your message. I am glad you found it useful :).
Best wishes,
Steven