In this guide, I will show you how to calculate the interquartile range (IQR) by using Microsoft Excel. I will also show you how to how to calculate the first and third quartiles for a dataset.
What is the IQR?
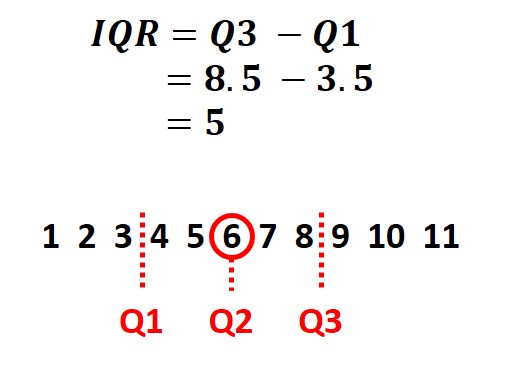
The IQR is the difference between the first (25th percentile) and third (75th percentile) quartiles. These are often abbreviated to Q1 and Q3 respectively.
The IQR is used to represent the middle (50%) spread of the data. When a dataset is sorted in order from the smallest to the largest values, it is possible to split the data into four parts (the quartiles).
Consider the simple example below. In it, Q1 is 3.5 (half way between 3 and 4) and Q3 is 8.5 (half way between 8 and 9). Thus, the IQR is 5 (ie 8.5 – 3.5).
How to calculate the IQR in Microsoft Excel
There is no direct formula to calculate the IQR in Excel, however, it is relatively straight forward to do. The easiest approach is to firstly calculate the Q1 and Q3 and then use these to determine the IQR.
Below is the steps recommended to calculate the IQR in Excel.
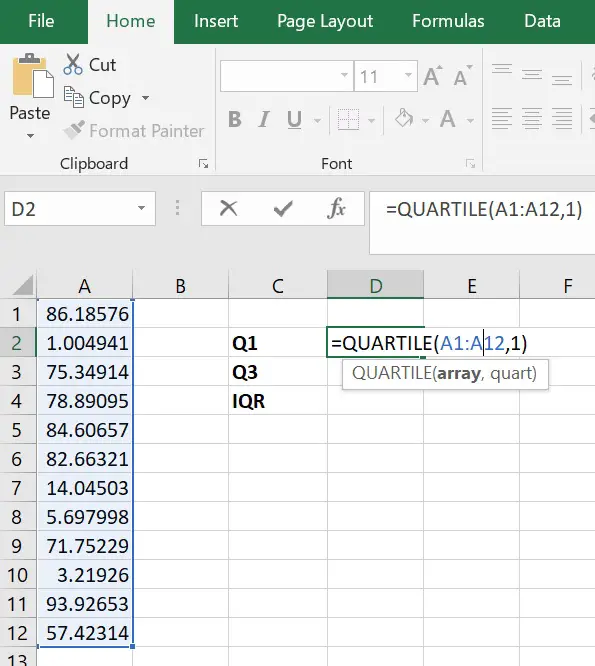
- To calculate the Q1 in Excel, click on an empty cell and type ‘=QUARTILE(array, 1)‘. Replace the ‘array‘ part with the data of interest. For this, simply click and drag on the cells containing all of the data. The ‘1‘ in the formula signifies Excel to return the Q1 of the data.
2. Next, we need to calculate Q3. To calculate Q3 in Excel, simply find an empty cell and enter the formula ‘=QUARTILE(array, 3)‘. Again, replacing the ‘array‘ part with the cells that contain the data of interest.
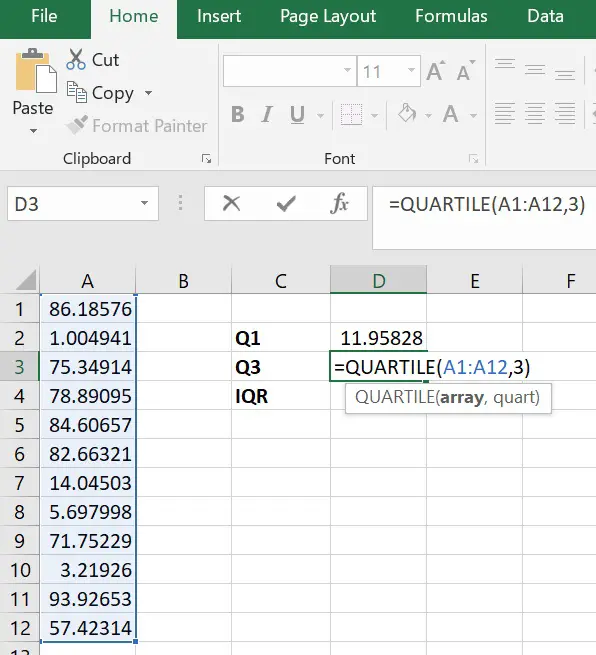
3. Finally, to calculate the IQR, simply subtract the Q1 value away from the Q3 value. In the example above, the formula used would be ‘=D3-D2‘.

Combine the approach to form one equation
The approach described above to calculate the IQR is rather
For example, the formula below would create the IQR in Excel. Just remember to replace the ‘array‘ components with the desired cells containing the data.
=QUARTILE(array, 3) - QUARTILE(array, 1)
Conclusion
The IQR is a measure of the middle dispersion of a dataset, basically the difference between Q1 and Q3. To calculate the IQR in Microsoft Excel, use the =QUARTILE function to calculate Q1 and Q3, and ultimately find the difference between these two values.
Microsoft Excel version used: 365 ProPlus

")

Thank you. This post helps me a lot.