In this tutorial, I will explain how to find the interquartile range (IQR) in SPSS. I will also show you how to find the the first (Q1) and third (Q3) quartiles.
What is the IQR?
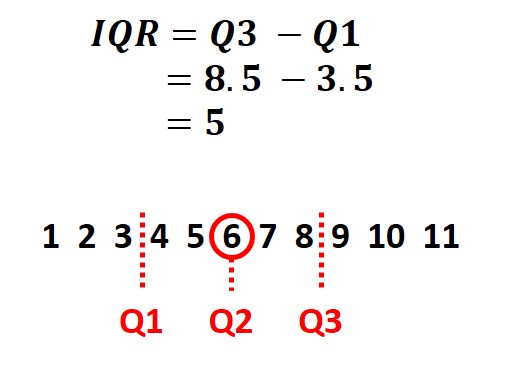
The IQR is a metric used to represent the midspread of the data. It is calculated by subtracting the 25th percentile (Q1) from the 75th percentile (Q3).
An example of the IQR calculation can be seen below.
How to find the IQR in SPSS
Finding the IQR in SPSS is relatively straight forward
To find the IQR in SPSS, simply follow the steps below.
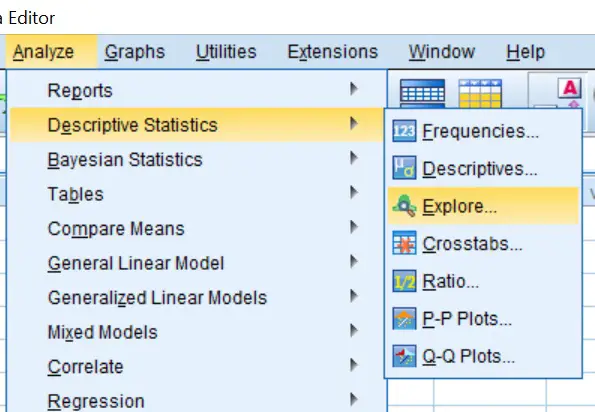
- Firstly, in SPSS, go to ‘Analyze > Descriptive Statistics > Explore‘. This will open the ‘Explore‘ window.
2. In the ‘Explore‘ window, drag the variable of interest over to the ‘Dependent List‘ box.
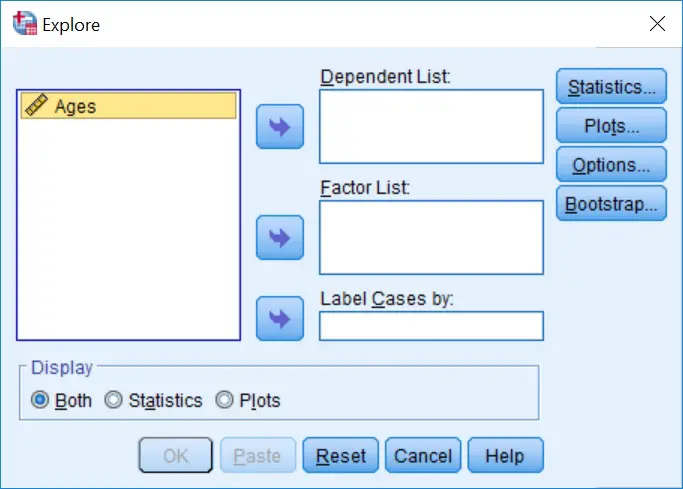
Finally, click the ‘OK‘ button.
The output
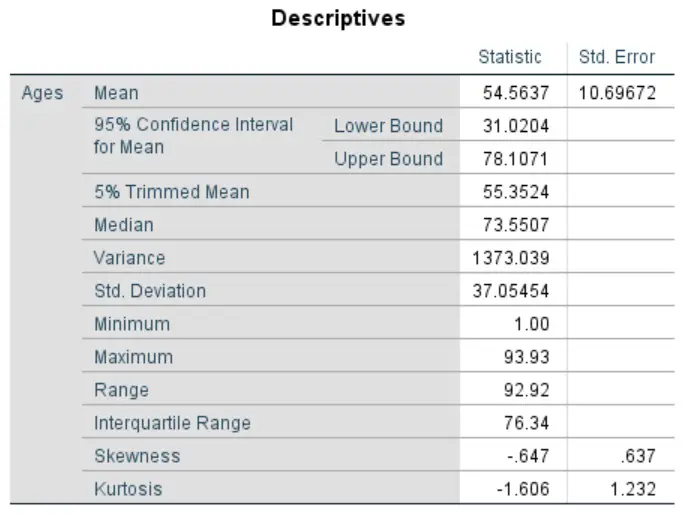
In the Output View, there will now be a table under a heading of ‘Descriptives‘. This output presents a lot of basic information about the variable, such as the mean, median and standard deviation.
Towards the bottom of the table, you will find the IQR. In this example, the IQR is ‘76.34‘.
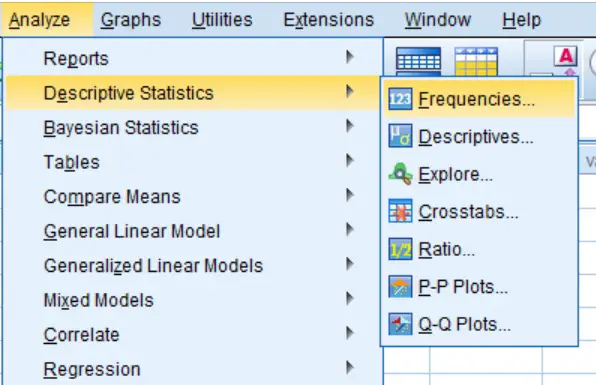
How to find the Q1 and Q3 in SPSS
There are a few ways to find the quartiles of a variable in SPSS. I will show you the way I do this.
- In SPSS, go to ‘Analyze > Descriptive Statistics > Frequencies‘. This will open the ‘Frequencies‘ window.
2. In the Frequencies window, drag the variable of interest over to the ‘Variable(s)‘ box. Then click the ‘Statistics‘ button.
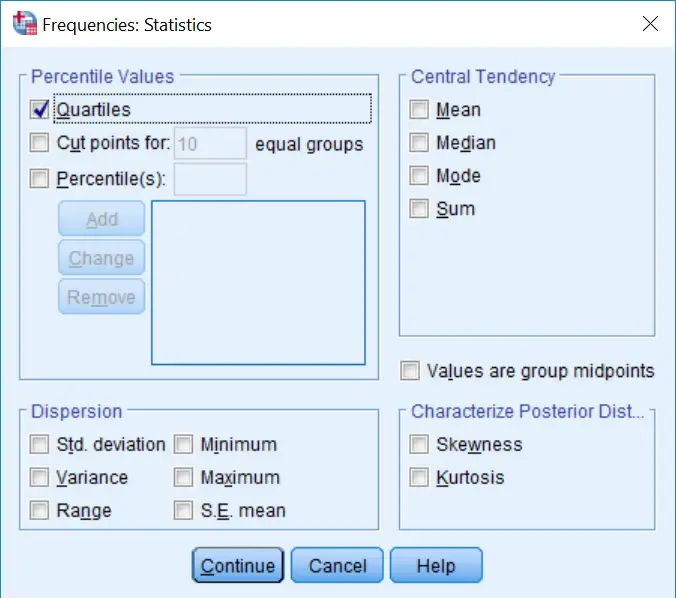
3. In the new window, click the ‘Quartiles‘ option. Then click the ‘Continue‘ button.
4. Finally, click the ‘OK‘ button.
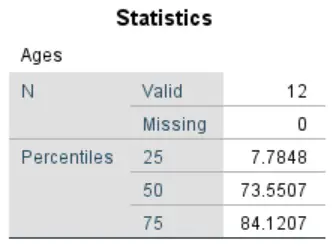
The output
In the Output View, you will find the Q1 (25th percentile) and Q3 (75th percentile) of the variable in a table with the heading ‘Statistics‘. There is also the median (50th percentile) as well.
Conclusion
In summary, I have shown you how to find the IQR in SPSS. This output can be seen when going to the ‘Explore‘ window (‘Analyze > Descriptive Statistics > Explore‘). I have also explained how to find the Q1 and Q3 of a variable.
SPSS version used: 25


