In this tutorial, I’m going to show you how to perform a two-sample F-test for variances in Microsoft Excel. I’ll show you how to generate the results, including a p-value, and will also interpret each output to explain what they mean.
Why perform a two-sample F-test?
The reason why you would perform a two-sample F-test for variances is to determine if the variances of two populations are equal.
This is important to know because certain hypothesis tests, such as an independent Student t-test, assumes that the two groups in the test have equal variances.
So, it’s important to know if the two groups have equal variance before performing an independent student t-test.
Example data
For this tutorial, I will be using the same data as used in my other tutorial on how to perform Student t-tests in Excel.
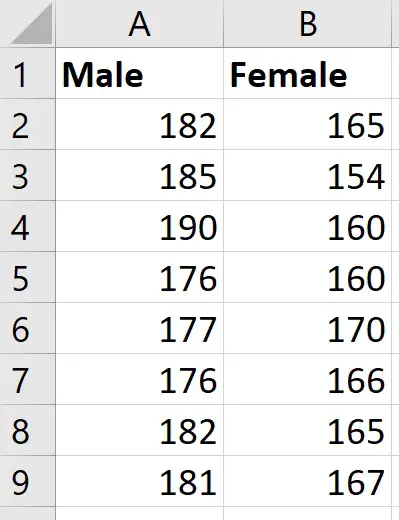
I have two groups: males and females. In each group there are 8 different participants, which I have measured their height in centimetres (cms).
How to perform a two-sample F-test in Excel
There are a few ways you can perform the F-test in Excel. You can either use the Data Analysis ToolkPak, or the F.TEST function; I’ll show you both methods.
Let’s start with the Data Analysis ToolPak method.
1. Install the Data Analysis ToolPak
The first method is to use the Data Analysis ToolPak. This is an add-on created by Microsoft to provide data analysis tools for statistical analyses.
To install the toolpak, go to File>Options, then select Add-ins.
At the bottom, you want to manage the Excel add-ins and click the Go button.
Then, ensure you tick the Analysis ToolPak add-in, and click OK.
Now, when you click on the Data ribbon at the top, you should see a Data Analysis button in a sub-section called Analyze.
2. Calculate the variance for each group
Before performing the F-test, I advise you calculate the variance for each group beforehand – you will see why this is useful shortly.
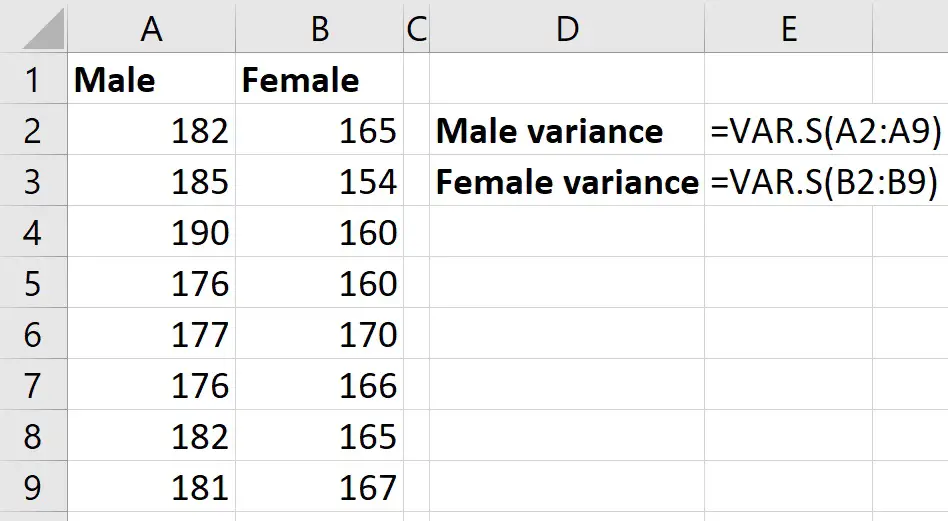
To calculate the variance, in a new cell, use the VAR.S function.
=VAR.S(number1, [number2],…)
- Number1 – Range of cells containing the first group data
- Number2 – Range of cells containing the second group data
Here are the formulas I used with my example data.
So, for my example data, the variance for males was 23.55 cm2 and the variance for females was 25.70 cm2.
Now we are ready to perform the F-test to determine if the two variances are significantly different.
3. Perform the F-test via the Data Analysis ToolPak
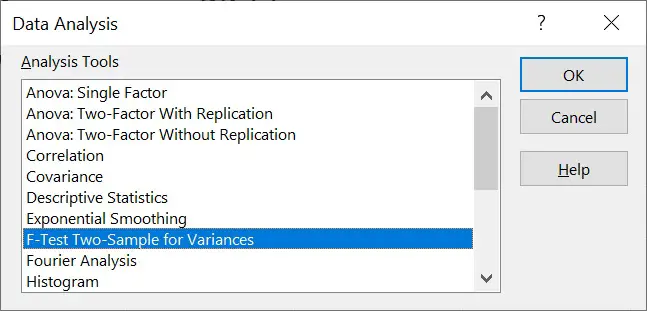
To perform the F-test, go to Data>Data Analysis.
Then from the list, select the F Test Two-Sample for Variances option and click OK.
Here is a breakdown of each option.
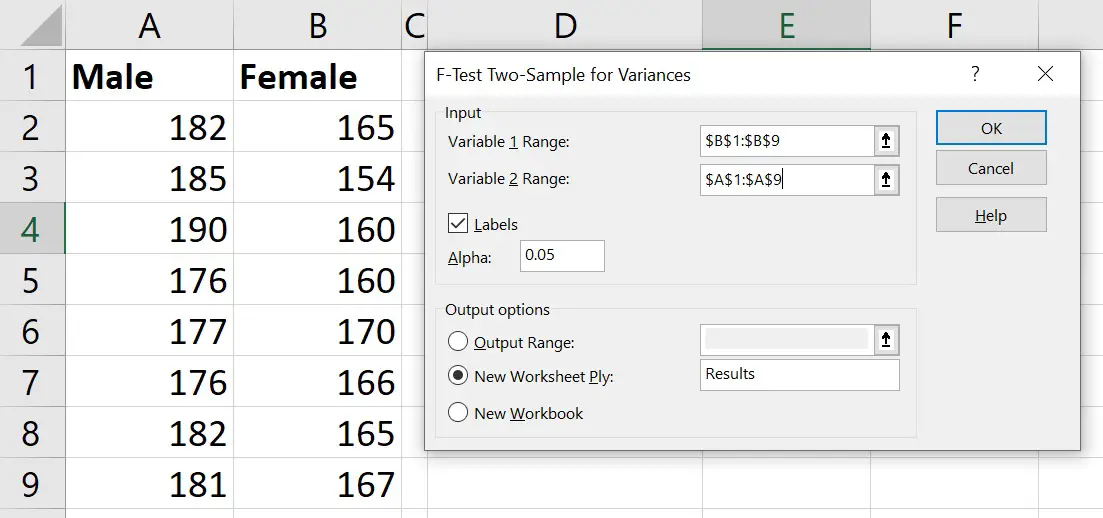
- Variable 1 Range – The range of cells containing the first group data. For Variable 1, it is recommended to input the group with the highest variance value so Excel can calculate the correct F value. This is the reason why we calculated the variance for each group beforehand! For my example, I will use the Female group since they had a larger variance compared with the Male group
- Variable 2 Range – The range of cells containing the second group data. For my example, I will enter the Male group data
- Labels – Select this if you have highlighted the group label
- Alpha – This is the significance threshold. By default this is set at 0.05. So, if the p<0.05, we can reject the null hypothesis and conclude that the test is statistically significant
The output options underneath are used to determine where the F-test results will be returned.
- Output Range – This option will allow you to select an area in the current sheet where you want to results to be placed
- New Worksheet Ply – This will save the results in a new sheet
- New Workbook – This option will save the results in an entirely new Excel document
For this example, I’ll select the second option and call the new sheet Results.
Finally, press the OK button to run the F-test.
Interpreting the F-test results
The F-test results should now be displayed in a table.
Here’s what my results table looks like.
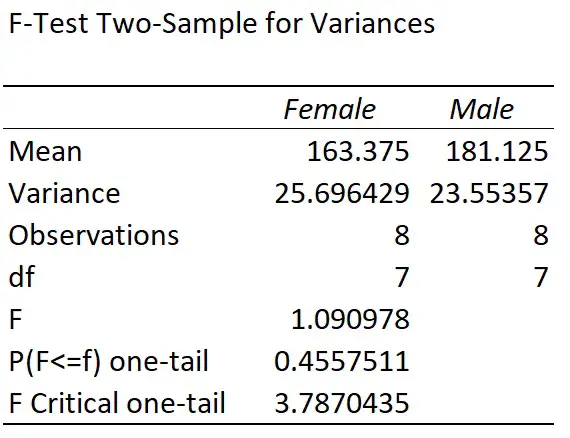
I’ll now break down each of these results in detail.
- Mean – This is the mean, or average, values for each of the two groups
- Variance – This is the same values as we calculated just before performing the test
- Observations – The number of data points in each group; so I had 8 participants in each group
- df – The degrees of freedom. This is calculated by performing observations – 1
- F – The F-value for the test. This is calculated by dividing the variance for the first variable, by the variance of the second variable
- P(F<=f) one-tail – The p-value for the F-test. Note, this is a one-tail analysis
- F Critical one-tail – The F Critical value for the test. Note, this is a one-tail analysis
Basically, Excel uses the degrees of freedom (df) for the two groups, as well as the previously selected alpha level, to work out the F Critical value.
By comparing the F-value to the F Critical value, we can determine the p-value.
For my example, p=0.46.
To interpret this value, we need to declare our two hypotheses.
- Null hypothesis – There is no difference in variance of height measures between the two populations
- Alternative hypothesis – Females have a higher variance for height measures compared with males
Note, that the alternative hypothesis is written in this way because the test performed here is a one-tailed test; I will show you how to calculate a p-value for a two-tailed test shortly.
If p<0.05, we would reject the null hypothesis and accept the alternative hypothesis.
On the other hand, we would fail to reject the null hypothesis if P>0.05.
Since my p-value is larger than 0.05, I will fail to reject the null hypothesis and conclude that there is no difference in variance of height measures between the two populations.
If this was the case, I could proceed with a T-test and assume the populations have equal variance.
If my p-value was less than 0.05, then I would assume the two populations have unequal variance when performing the T-test.
How to perform a two-tailed two-sample F-test in Excel
There is also a function you can use that will return the two-tailed p-value for the test, instead of the one-tailed p-value created through the Data Analysis ToolPak.
To do this, use the F.TEST function
=F.TEST(array1, array2)
- Array1 – Range of cells containing the first group data
- Array2 – Range of cells containing the second group data
Interpreting the results
Notice that this p-value is different to that reported by the Data Analysis ToolPak; infact, it is twice the value.
This is because the F.TEST function returns the two-tailed p-value, whereas the Data Analysis ToolPak only returns the one-tailed p-value.
To interpret this p-value we again need to report our two hypotheses.
- Null hypothesis – There is no difference in variance of height measures between the two populations
- Alternative hypothesis – There is a difference in variance of height measures between the two populations
Since the p-value is greater than my alpha of 0.05, we fail to reject the null hypothesis and conclude again that there is no difference in variance of height measures between the two populations.
Performing an F-test in Excel: Final words
In this tutorial, I have shown you how to perform a two-sample F-test for variances in Microsoft Excel.
The one-tailed F-test can be performed by using the Data Analysis ToolPak. To perform a two-tailed F-test, use the F.TEST function to return the two-tailed p-value.
Microsoft Excel version used: 365 ProPlus

")
