What is the Pfaffl method?
The Pfaffl method, named after it’s curator Michael Pfaffl, is used to calculate relative gene expression data while accounting for differences in primer efficiencies. Pfaffl published his formula in the journal Nucleic Acids Research in 2001. Unlike the delta-delta Ct method, which assumes primer efficiencies are similar (usually between 90 – 110%) between the gene of interest (GOI) and the housekeeping gene (HKG), the Pfaffl method accounts for any efficiency differences to increase reproducibility.
In order to perform the Pfaffl formula, you require primer efficiencies for your GOI and HKG, as well as cycle threshold (Ct) values for your samples.
Mastering qPCR
A video tutorial on how to use the Pfaffl method for qPCR data analysis can be found in our Mastering qPCR course.
>>Use code 20QPCR to get 20% off<<
What is the Pfaffl formula?
The Pfaffl formula is presented below:
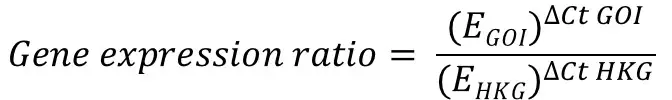 The ‘E‘ in the equation refers to the primer efficiency.
Looks scary, doesn’t it? It actually isn’t. I will use an example below and break down the equation so it is easier to understand.
How to use the Pfaffl formula
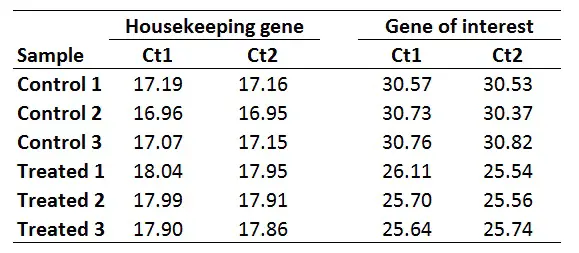
For this example, I will be using the same dataset as from the delta-delta Ct guide, where I have Ct values (performed in duplicate) for control and treated samples and an HKG and GOI for each. This could be a theoretical example of a cell culture experiment which has been repeated three times, so I have three independent sets of control and treated samples.
 1. Calculate primer efficiencies
The first thing that is required for the Pfaffl method is the primer efficiencies for your GOI and the HKG. How to calculate primer efficiencies has been described in detail previously, so please refer to this post before continuing further.
Once you have the primer efficiencies, these will be in the format of a percentage, for example, 98%. However, this percentage is not entered directly into the Pfaffl equation, rather it needs to be converted.
A converted primer efficiency value of ‘2‘ indicates a 100% efficiency. This is the case when using the delta-delta Ct method. In other words, for every PCR cycle, the amount of DNA will multiply by 2. On the other hand, an efficiency of 90% would give a converted value of ‘1.90‘ and an efficiency of 110% would give a value of ‘2.10‘.
If you are still unsure, an easy way to convert the primer efficiency percentage is to divide the percentage by 100 and add 1.

For this example, I will pretend I have calculated the primer efficiency of my GOI as ‘1.93‘ (93%) and the HKG as ‘2.01‘ (101%).
2. Average your technical replicates
Once you have your primer efficiencies, the next step is to calculate the average Ct values from the technical replicates, in this case, I have duplicates for all the samples.
Using the sample data from above, this is what I get:
 3. Select a calibrator/reference sample or samples
The next step is to decide which sample, or group of samples, to use as a calibrator/reference when calculating the ∆Ct values for all the samples. This is the part which confuses a lot of people. Basically, this all depends on your experiment set-up.
A common way of doing this is to just match the experimental samples and determine the relative gene expression ratios separately. This is all well and true for experiments that have matched pairs, such as the case in cell culture experiments. However, this is difficult when the two experimental groups vary in n numbers and do not have matched pairs.
Another way to select a calibrator/reference sample is to pick the sample with the highest Ct value, so the sample with the lowest gene expression. This way, all the results will be relative to this sample.
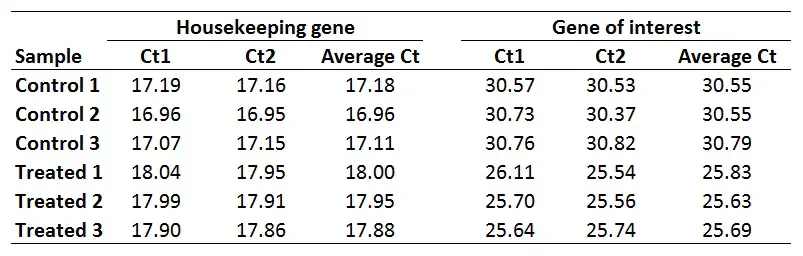
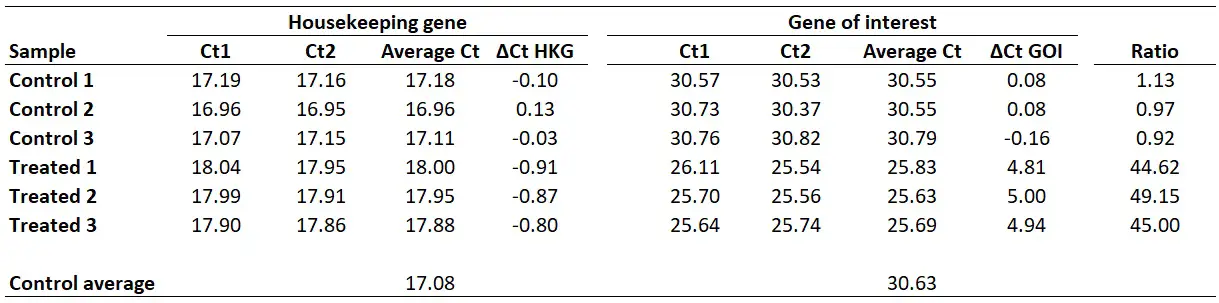
I personally average the ‘Average Ct’ values of the biological replicates of the control group to create a ‘Control average’. By doing so would mean that the results are presented relative to the control average Ct values.
Whichever sample, or group of samples, you use as your calibrator/reference is fine so long as this is consistent throughout the analyses and is reported in the results so it is clear. Remember, the results produced at the end are relative gene expression values.
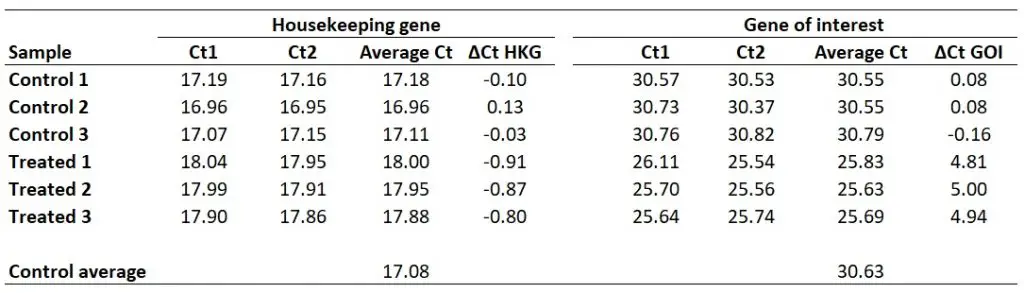
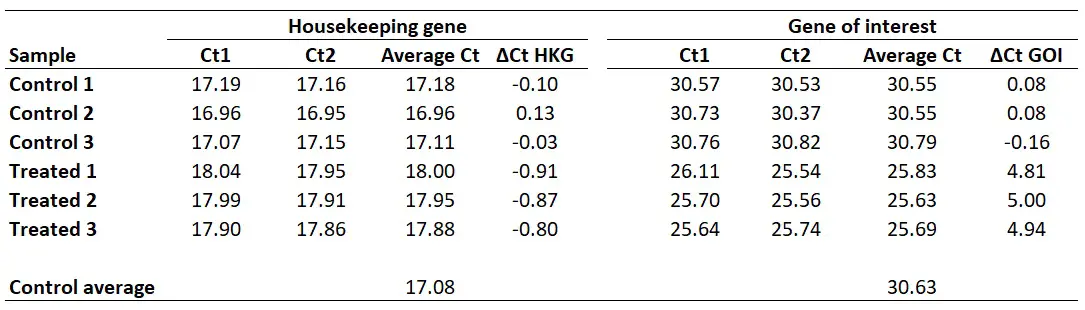
With this in mind, we next need to average the ‘average Ct‘ values for the control samples for the HKG and GOI. So, for the HKG this will be the average of ‘17.18‘, ‘16.96‘ and ‘17.11‘, which works out as ‘17.08‘. For the GOI this will be the average of ‘30.55‘, ‘30.55‘ and ‘30.79‘, so ‘30.63‘ will be the average value.
 4. Calculate delta Ct values
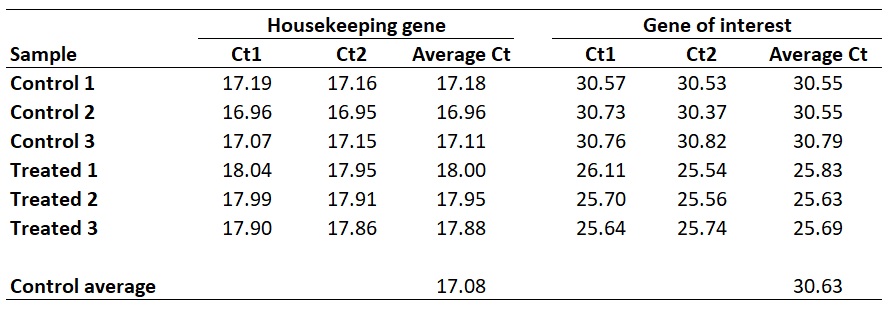
Next, we need to calculate ∆Ct separately for each gene in each sample. To do this, simply subtract the newly created ‘Control average‘ (now acting as the calibrator/reference) value from the ‘Average Ct‘ of each sample (including all of the control samples). By using the ‘Control average‘ this will enable us to create ∆Ct values for each control sample as well as the treated samples.
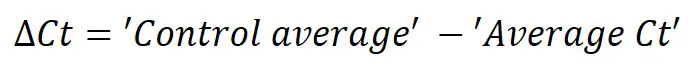 So, to calculate the ∆Ct for the HKG in sample ‘Control 1‘, you need to do 17.08 – 17.18, which equals ‘-0.10‘. By repeating this for all the samples, for both genes, we get the results below.
 5. Enter everything into the Pfaffl equation
We now have the ∆Ct values for both genes in all the samples. We also know our primer efficiencies (step 1).
Therefore, we can now enter everything into the Pfaffl equation to get the gene expression ratio.
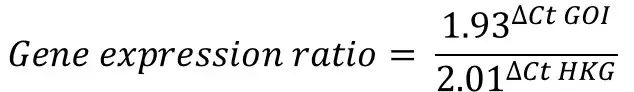 By doing this for all the samples in the example, this is what we get:
Analysing qPCR results with multiple reference genes
If you have more than one reference/housekeeping gene, it may be worth checking out the guide on analysing qPCR data with numerous reference genes. This approach is very similar to the Pfaffl method, with a slight difference in that it can handle two or more reference genes to normalise to.
The FREE Pfaffl Method Excel template
For those still struggling with the analysis, or just want an easy template to use to quickly calculate the gene expression ratio using the Pfaffl method, I have created a Microsoft Excel template to freely download. The file is suitable for the above example, i.e. when there are two experimental groups (control and treated, for example) with three biological replicates in each, with a GOI and HKG.
Click here to download the Pfaffl method data analysis template.


Hi Steven, Thank you for your explanations. I was wondering if to be able to use the Pffafel method, the fluorescence threshold must be the same for HKG and GOI or should we use the automatic threshold?
Hi Lisa,
Many thanks for your feedback.
The threshold does not have to be the same between the different genes. I always suggest to use your machine’s automatic threshold options, especialy if you have little experience with qPCR.
Hope that helps,
Steven
Hi Steven,
just bumped into this post and found it very helpful. I’m struggling to get my head around the info I gathered about the standard Livak method and the efficiency corrected Pfaffl method.
As far as I understood, with the Pfaffl equation you provided you would get the equivalent of the 2^DDCt of the Livak method (i.e. the fold change of gene expression). Now, what if I would like to represent the log fold change? With Livak it was just a matter of a log2 transformation, but what log base should I use with Pfaffl?
Thanks a lot!
Andrea
Hi Andrea,
You can also perform a log2 transformation after using the Pfaffl method.
I hope that helps,
Steven
Good afternoon Dr. Dradburn,
Excellent explanation!!
Can this method be used in miRNA samples extracted from serum or plasma ? I know in these cases a spike in control from C. elegans is the most common way for normalization.
Best regards
Adrian
Hi Adrian,
Yes, I’m sure it can be used. I have never used it for this purpose but if you have a reference gene and have calculated the primer efficiencies for your gene of interest and the reference gene then I don’t see why not.
Best wishes,
Steven
Hi Dr Steven Bradburn.
Thank you very much for your clear explanations. The question that arises is why the analysis of the relative expression by the Livak equation is reported as fold change, while when applying the Pfaffl equation to adjust for different efficiencies, it is reported as relative gene expression ratio, when it is also getting the fold change with respect to the control?
For me it is the same, only corrected for efficiencies different than 2. I thank you in advance for your answer. regards
Hi Alma,
Many thanks for your message. I too have also wondered this. You are right, they are representing the same thing. The name of the output is often interchanged and mostly referred to fold gene expression.
Best wishes,
Steven
Hi Steven,
Thank you very much for this amazing Explanation!! Awesome!
I have another specific Question. Which method can be used if you don’t have all the conditions applied for the Pfaffl method? For example: I want to compare the Expression of a target gene in differenct cell lines and tissues. In this case, I do not have controls like treated and non-treated but just simple cell culture and tissues.
Could you help me with that?
Many thanks
Best
Hi Johannes,
Thank you very much for your comment 🙂
In this case, you can just select a single sample (or the average of the group) of one cell line from your experiment as your ‘calibrator sample’. Then the results will be relative to this cell line.
I hope that makes sense?
Steven
Hi Steven,
Many thanks for the informative website and explanations. But I am struggling to define the calibrator/reference when calculating the ∆Ct for my genes.
Here is my experimental setup:
Gr.1 : Wild type mice + treated
Gr.2: Alzheimer’s mice + treated
Gr.3: Wild type mice + non-treated (placebo)
Gr.4: Alzheimer’s mice + non-treated (placebo)
Gr.5: Old wild type mice + non-treated
Gr.6: Old Alzheimer’s mice + non-treated
What do you suggest could be a proper calibrator? Or should I use multiple calibrators?
Best,
Imen
Hi Imen,
Many thanks for your comment.
In your case I would use either a single sample or the average of the group 3 (Wild type and non-treated) as the calibrator in the data analysis. I think this is the best approach for your experiment.
Goodluck with it.
Steven
Dear Dr . Bradburn,
how I can know that the efficiency of the premieres not similar and then I have to shift from delta-delta Ct method to Pfaffl method.
best regards
Ali
Hi Ali,
Many thanks for your comment.
To test the efficiency of your primers you will need to create a series of standards and perform a qPCR on these. Try looking at our primer efficiency guide to see if it makes sense.
Best wishes,
Steven
Yes, it makes complete sense! Thanks so much for your help! I am using Pffafl method I believe it works as well, right?
Do you have any tips, or perhaps an article, for the statistics of the data. I was planning on simple ANOVA and Tukey test. I have 5 groups of interest (developmental stages) to compare.
Thanks again1
You are very welcome, I am glad it helps.
For the statistics, if you are interested in any differences between the experimental groups, I would firstly log-transform your gene expression values – since this will help with the data distribution – and perform a One-Way ANOVA with a suitable post-hoc analysis (eg Tukey as you suggest).
I have articles on how to perform a One-Way ANOVA in SPSS and GraphPad Prism, if you use either of them programs?
Hi Steven,
Thank you so much for this article, it clarifies a lot!
However I still have some questions about the calibrator. When you say you avarage the group and use the avarage as the value for calibration, than you won’t get the fold expression avarage equals 1 for those samples, since their individual values are different from the avarage. Am I right?
In my case I want to compare the expression of my target gene along different developmental stages for choosing the calibrator I tried to set arbitrarily one of my stages (the early one, for example). Now what? Do I avarage my 3 biological replicates and use that number againts all the other samples to calibrate? Including the individual values of each of the 3 biological replicates I chose?
Another question is, when chosing the sample with the lowest expression (highest CT value) I dont quite understand if I should look at the CT values I get in general (for reference and target genes) and simply choose the highest, or the highest Ct value I get for my target gene. Or even, the highest avarage of Ct values among my biological replicates of a given sample?
I hope my questions are clear. I appreciate the help.
Hi Sylvia,
Many thanks for your questions. Here are the answers I can think of:
1. That is correct, you will not get the fold expression as 1 for these samples when using the average calibrator sample value. To normalise the gene expression levels to a control group average (earliest developmental stage in your instance) so this group will have a fold expression value of ‘1’ when the samples are averaged, make a new column and divide all of the gene expression values for all the samples by the average gene expression value of the earliest developmental stage group. Then average the gene expression values for all the groups of interest. The control group average gene expression values should now be set to ‘1’. Does that make sense?
2. If I was doing the analyses, I would select the earliest developmental stage as the calibrator sample. You could just select any random sample from this group. Or you could average the Ct values for this group and use this instead. Again, don’t get too worked up on which sample to use as the calibrator. Since the analyses is relative, it will not change the outcome, but it will change the way the results are presented.
3. This method is more appropriate when performing relative quantities (2^deltaCt) since this only requires one gene of interest. So for this, it will be best to calculate delta-Ct and select the sample with the highest or lowest value.
Does this make sense?
Thanks
Steven
Hello,
Nice explanation ! 🙂
I had a question concerning primer efficiencies. Let’s say I run each condition in triplicate (technical).
If I want to compare “condition A” vs “condition B” :
I have 3 ct values per conditions, and so 3 primer efficiencies.
Should I average the 3 primer efficiencies ?
Or should I calculate, for each condition (with their respective efficiency), the delta delta ct then average them ?
Best regards,
Hi Quentin,
Thanks for your comment!
If you have performed the experiment 3 separate times (biological replicates) this would be ideal to keep them all separate and use the primer efficiencies for the corresponding conditions.
If you have technical replicates, however, I would average these before you do the calculations.
Does that make sense?
Best wishes,
Steven
Hi Kaia
Many thanks for the message and sorry this is a late reply. Here are the answers to your questions:
1. The main difference between the Pfaffl method and the Delta-Delta Ct method is the former is able to accept different primer efficiencies. If you entered the same data into the Pfaffl equation that was in the Delta-Delta Ct equation, and entered the primer efficiencies of ‘2’ to represent 100% efficiency, then you will more or less get exactly the same result in each equation.
2. Yes, the output name is just what the authors call it. The Pfaffl method output is usually referred to as a ratio. But you can use any term so long as you’re consistant. So, fold gene expression, relative gene expression etc.
3. The fold gene expression is a fold value relative to the calibrator sample(s). Usually this is the control group or a control sample. So a value of 30 would indicate a 30 fold upregulation relative to the calibrator (i.e. control group).
4. If you want to do statistical analysis on the gene expression values, I firstly recommend log-transforming them. Then perform the stats on these values.
I hope these all make sense – let me know if they are not clear.
Best wishes,
Steven
Thank for your post.
Please show me how to set up the quantitative real-time PCR in order to utilize the Pfaffl method in my situation. Here is my purpose
I would like to compare the expression of gene Z between bacteria A and B. I use gene D as a reference gene for both A and B.
Hello,
Thank you for your message. Sure. Do you also have primer efficiencies for the gene of interest and reference genes?
Best wishes,
Steven
Hi Steven!
Thank you for your amazing explanation. Could you please show me how to do the statistic analysis of qPCR data?
I would like to compare the relative expression of a GOI between the wild type strain and the mutant strain of a bacteria using 1 reference gene (HKG). Samples were collected at different time points. For example, the result of samples at 6 hours of incubation:
1. Cq of GOI of Wild type strain in triplicate ( 19.92; 19.92; 21.91), and of Mutant strain (26.73; 25.37; 26.3).
2. Cq of Reference gene (HKG) of Wild type in triplicate (19.95; 19.59; 20.72), and of Mutant strain (24.01; 22.29; 23.59)
3. The efficiency of GOI and HKG are 2.01 and 1.9 respectively.
Using the Pfaffl method I got the result that gene expression ratio (mutan/ wild type) is 0.18
My question is how to statistic test to conclude that the expression of GOI of the wild type strain is significantly higher than that of mutant strain?
Hello,
Many thanks for your comments 🙂
For statistical analyses you would require more biological replicates as it sounds like you only have 1 sample in each group. I would advise repeating your experiment a minimum of 3 times to get sufficient data for statistical analysis. I would also suggest to log-transform your gene expression values at the end before you start the stats.
I hope that helps.
Thanks,
Steven
Hi, thanks for the post.
Just some clarifications:
You should not plot the two bars separetely if you already calculated the relative expression, i.e, fold changes. The problem with this approach is that you’re creating two populations that are not independent anymore. If you want to show fold-changes, you should omit the control, since the treated values are already relative to the control. If you still prefer to show this way, just don’t perform statistics on those values. You should compare the Delta CT for the two groups in T tests and such. If you compare the fold-changes to the control in statistical procedures, you’re hugely inflating the differences as the control population has mean 1 with a very tiny variance, which is not true when you look at only the normalized expression (Delta Ct) mean and variances.
When we say qPCR for gene expression is relative, this is relative in two possible ways: 1. Gene of interest relative to one or more Reference Genes.
2. Relative in a sense of a sample to another. Although, a lot of designs are not paired and should not be comparing samples on a pairwise level. For these cases, the best way is to simply average group1 and divide by the considered reference group. Thus, avg_group1 / avg_group2 = fold change of Group1 relative to group2.
Best regards,
Thyago
Hi Thyago,
Many thanks for your comment and the points you raised.
I agree that it is sometimes useless to include the control group in the bar chart since the average of this fold expression will be 1 – I see others remove it and draw a horizontal line at 1 instead to represent the control/calibrator relative values.
For the statistics – this is true. The fold expression values will not be normally distributed – in fact in this instance a one-sample test would be best since everything is compared to 1. Otherwise, delta Ct values will be normally distributed and so parametric tests would be more appropriate on these. I will go over the articles to include a sub-section on statistical analysis based on these points for clarification.
I agree with the terminology and like to use normalise to state the normalization/standardisation to the reference/housekeeping genes and relative to refer to the group/samples relative to (e.g. calibrator, control sample). I will go over the articles and clarify these points too.
Best wishes,
Steven
thanks a lot
Hi Steven,
First of all, thanks for your explanation.
Secondly, I would like to ask you if I could use this method when my primers efficiencies are near to 60% and 100% or I should improve the first primers efficiency.
Best wishes,
Lia
Hi Lia
I personally would try to optimise the 60% primer set. I wouldn’t use anything outside the 90 – 110 % range. Is there primer dimer present, as this can significantly reduce the efficiency. Also what is the size of the PCR product?
If optimising the current primer set doesn’t work, it may be better and cheaper to re-design them.
Hope that helps,
Steven
Hi Steven,
Is it okay to do statistics on gene expression ratios? Is there any requirement of log transformation?
Hi Lovepreet,
Many thanks for your comment. Sure, you can do statistics on the gene expression ratios. Log transformation is only needed if your data is heavily skewed.
Best wishes,
Steven
Hi Steven,
Thank you for your response. I was reading the original article and found that author presented mean CP of biological reps and calculated delta CP from the mean values. I am really confused which way to go? Either calculating ratios for individual reps or ratio from mean of biological reps. In case of calculating ratio from mean of biological reps, how can I calculate the standard error or standard deviation?
Best Regards,
Lovepreet
Hi Lovepreet,
That is correct, the original paper presented average Cp across the biological repeats. They then calculated gene expression ratios separately from each experimental pair, so using the samples from the paper this would be:
TyrA (Sample rep 1) v TyrA (Control rep 1) = Gene expression ratio 1
TyrA (Sample rep 2) v TyrA (Control rep 2) = Gene expression ratio 2
TyrA (Sample rep 3) v TyrA (Control rep 3) = Gene expression ratio 3
They would calculate the SE and SD from Gene expression ratio 1, 2 and 3 from the experimental pairs. Does that make sense?
The reason I compare all my samples to the average delta Ct of the control group is because sometimes you may not have experimental pairs in experiments. For example, when the two groups have different n numbers e.g. in an animal study it may be common to have different number of animal in each group. Or in the case of looking at expression levels in human tissues.
I hope that makes sense? I will amend the article to make this a bit clearer.
Thanks
Steven
Dear Steven, thank you so much for your clear step by step explanations!
Wish you all the best)!
Nicely explained Steven.Good work!
Thank you 🙂
Hi Steven,
Just to ask, the green box does not calculate anything? There is no formula within it?
Kind Regards,
Rupika
Hi Rupika,
Thanks for the message and for letting me know. I don’t know what happened but the formula had disappeared. I have since re-uploaded the file so it should now work.
Let me know if you get stuck with anything. 🙂
Best wishes,
Steven