What is a Pearson’s chi-square test?
A Pearson’s chi-square test, also known as a chi-square test, is a statistical approach to determine if there is a difference between two or more groups of categorical variables. For example, to see if the distribution of males and females differs between control and treated groups of an experiment requires a Pearson’s chi-square test.
Assumptions of a Pearson’s chi-square test
There are just two general assumptions that data has to pass before undertaking a Pearson’s chi-square test. These assumptions are:
- The variables of interest should be categorical data (either ordinal or nominal).
- There should be two or more independent groups of interest.
How to perform a Pearson’s chi-square test in SPSS
To perform a Pearson’s chi-square test in SPSS, you need to have two categorical variables, such as counts (1, 2, 3 etc.). I will apply the above example to explore the difference in male and female numbers between two groups (control and treated).
The null hypothesis would be:
“There is no difference in male and female proportions between the control and treated group.”
The alternative hypothesis would be:
“There is a difference in male and female proportions between the control and treated group.”
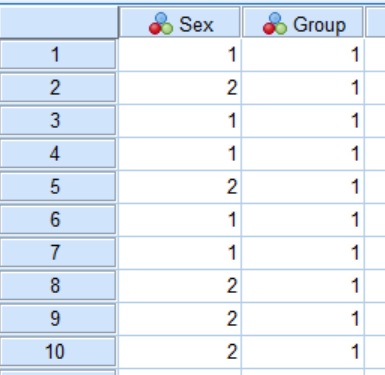
In SPSS, I have created a simple dataset containing two variables. The first variable (Sex) contains the information regarding the sex of the individual. I have assigned the value of ‘1‘ to indicate a male and ‘2‘ to represent a female. The Group variable refers to which group each participant is in, so that ‘1‘ indicates the controls and ‘2‘ is assigned to the experimental group. In total, there are 40 individuals, 20 in each group.
Below is a snapshot of some of the data within SPSS.
Performing the test
Now we have the dataset, we can now perform the Pearson’s chi-square test in SPSS.
- Firstly, go to
Analyze > Descriptive Statistics > Crosstabs....
 2. A new window will now appear. In it, move one of the variables into the
 Row(s) window and the other variable into the Column(s) window.
 3. Next, click the
 Statistics... button and on the new window that opens, tick the option for Chi-square.
 Now click the
 Continue button.
4. Next, click the Cells... button. In the new window, tick the options for Row, Column and Total under the Percentages header. This will give the percentages within each subgroup in the results output.
 Click the
 Continue button.
5. Finally, perform the test by clicking on the OK button.
The output
If you now go to the SPSS output window, you will see three sections titled Case Processing Summary, Crosstabulation and Chi-Square Tests.
The first contains information regarding the number of cases involved in the test. In the Crosstabulation window, there are further descriptive information regarding the numbers and proportions (in percentages) of males or females, in this example, for each group.
The statistical output we are interested in can be found in the final window: Chi-Square Tests.
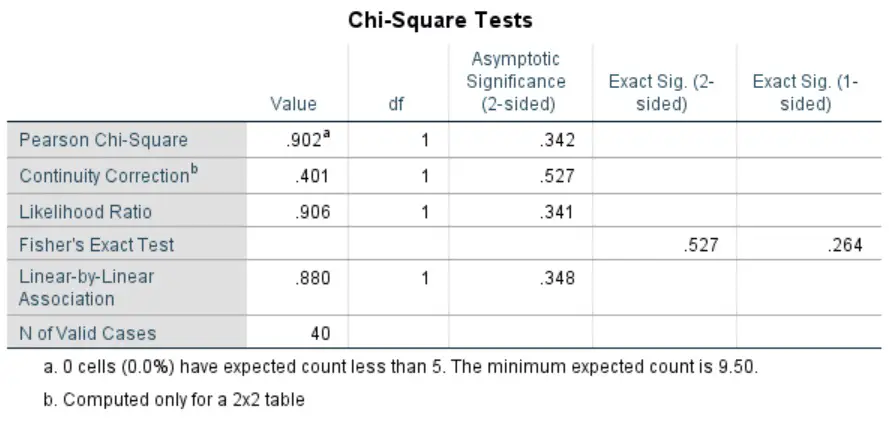
Since we are interested in the Pearson’s chi-square test, we need to look at the values in the first row. There are a few figures quoted in each column, these are:
Value– This is the chi-square (x2) statistic.df– The degrees of freedom in the analysis.Asymptotic Significance (2-sided)– The P value for a 2-sided analysis.Exact Sig. (2-sided)– The exact P value for a 2-sided analysis.Exact Sig. (1-sided)– The exact P value for a 1-sided analysis.
It is worth noting that if any of the cells in the analysis contains less than 5 counts, then we would need to refer to the Fisher's Exact Test instead of the Pearson’s chi-square test.
Interpretation
In our example, we can see that the P value is ‘0.342‘, which is just above our significance threshold of P<0.05. Thus, we accept the null hypothesis and reject the alternative hypothesis.
Reporting
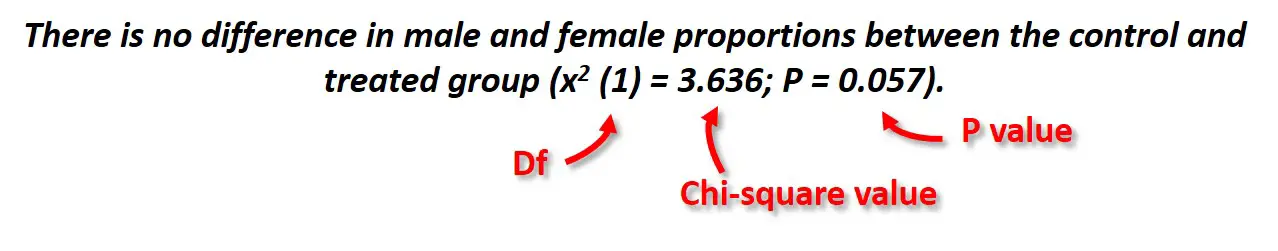
To report the analysis of a Pearson’s chi-square test, it is often useful to present the chi-square statistic, the degrees of freedom and the P value. Below is a breakdown of the reporting style for a Pearson’s chi-square test.
IBM SPSS version used: 24
Featured image credit: Quinn Dombrowski (via Flickr)


