The very first thing you should do before performing any statistical test, is to see whether your data is normally distributed. Normality testing in SPSS will reveal more about the dataset and ultimately decide which statistical test you should perform.
How to test for normality in SPSS
The dataset
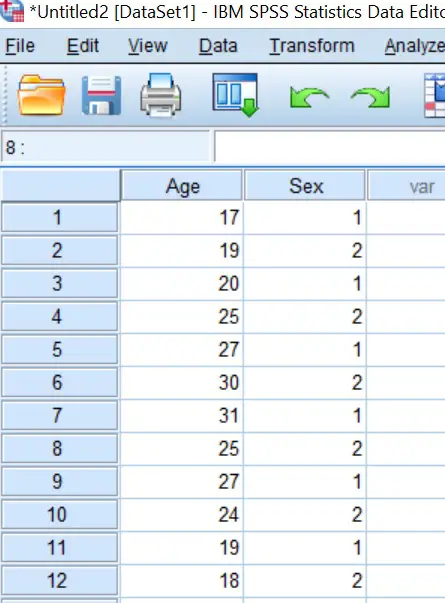
The first thing you will need is some data (of course!) in the SPSS file. I have created an example dataset that I will be using for this guide. It is simply a file containing two variables of ages (in years) and the sex of a population. In total there are 40 subjects, half of which are male and the other half female.
 Performing the normality test
Now we have a dataset, we can go ahead and perform the normality tests. There are a few ways to determine whether your data is normally distributed, however, for those that are new to normality testing in SPSS, I suggest starting off with the Shapiro-Wilk test, which I will describe how to do in further detail below.
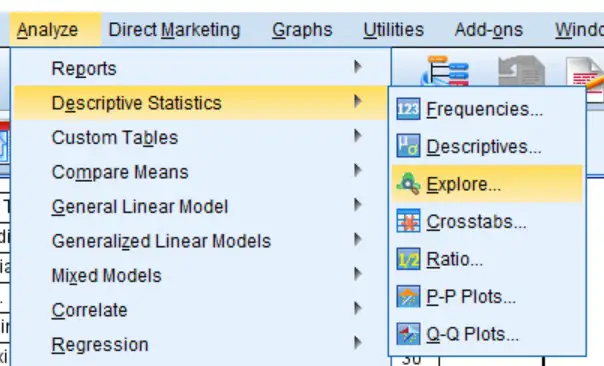
- Firstly, go to ‘Analyze > Descriptive Statistics > Explore …‘.
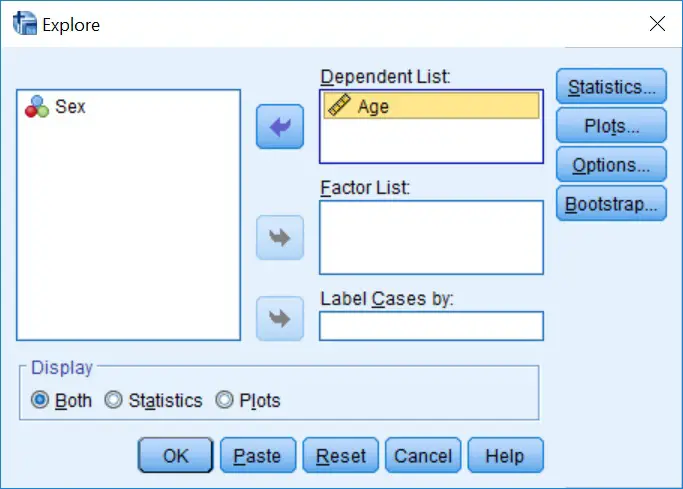
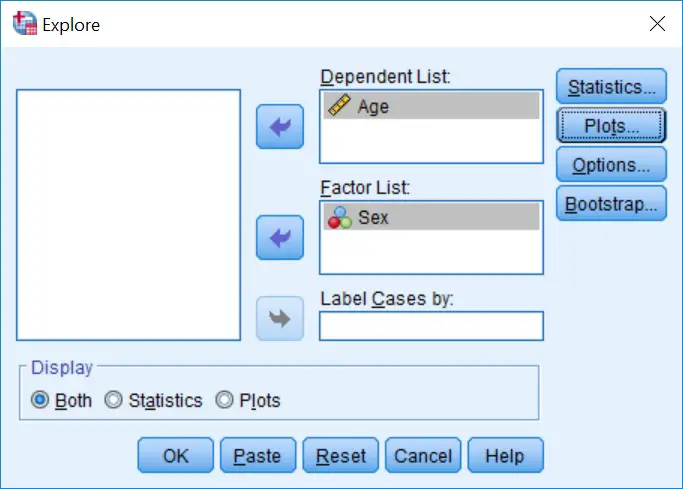
 2. A new window called ‘Explore‘ should now be open. Let’s firstly determine if the data (ages of subjects) for the whole dataset is normally distributed. To do this, I will move the ‘Age‘ variable over to the ‘Dependent List‘ box. Place whatever variable you want to test into this box.
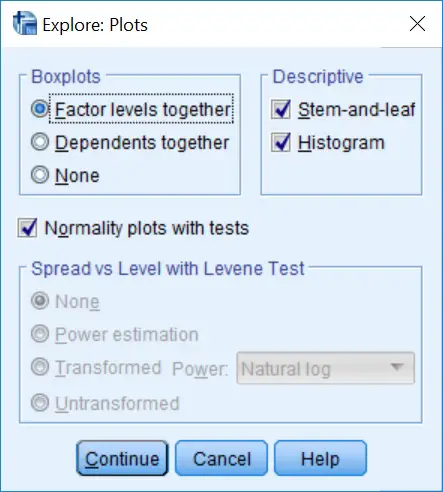
 3. To select the normality tests, next click on the ‘Plots…‘ button. This will open up another window with a variety of options. Tick the ‘Normality plots with tests‘ option, since this will enable the normality tests. Also, I find it useful to view the histograms of the data too, so tick the ‘Histogram‘ option under the ‘Descriptive‘ heading.
 4. Click the ‘Continue‘ button on the ‘Plots‘ window and then the ‘OK‘ button on the ‘Explore‘ window to perform the tests.
The output
If you now go to the SPSS Output window, you will see a plethora of information. The first box (‘Case Processing Summary‘) will inform you about how many samples were included in the investigations. The box below this (‘Descriptives‘) is useful to look at to understand more about your dataset. Here you will find information such as the mean, 95% confidence intervals and standard deviation. However, for the purpose of normality testing, the results we are interested are presented in the third box called ‘Tests of Normality‘.
 For the tests of normality, SPSS performs two different tests: the Kolmogorov-Smirnov and the Shapiro-Wilk tests. The main reason you would choose to look at one test over the other is based on the number of samples in the analysis. Generally speaking, the Shapiro-Wilk test is useful when there are small to medium sample datasets (up to 2000 samples), whereas the Kolmogorov-Smirnov test is preferred when there are larger sample sizes.
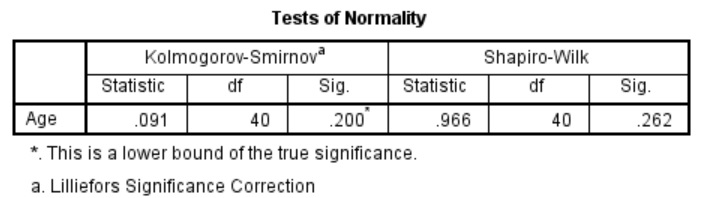
By concentrating on the ‘Shapiro-Wilk‘ test in the above example, there are three figures quoted.
- Statistic: This is the W statistic.
- df: The degrees of freedom in the analysis.
- Sig.: The P value.
To determine if the data is normally distributed by looking at the Shapiro-Wilk results, we just need to look at the ‘Sig.‘ column. If P<0.05, then this would indicate a significant result, i.e. the data is not normally distributed. Alternatively, if P>0.05 in the Shapiro-Wilk test, this would suggest that the data is normally distributed. People often get mixed up between these results.
Interpretation
In the above example, we can see that there is a ‘Sig.‘ value of 0.262 for the Shapiro-Wilk test. Therefore, these results indicate that the age of the subjects in this dataset is normally distributed.
Separating the results by a group
Additionally, there is an option to test for normality separately for individual groups. As in the example above, we could further investigate if the data for males and females is normally distributed.
To do this, repeat steps 1 and 2 above, however this time also place the group you want the results to be split by into the ‘Factor List‘ box. Here is what our example would look like.
 By running this, you will see that the results in the Output window are stratified by the group specified. So there are separate results for the tests of normality between sexes.
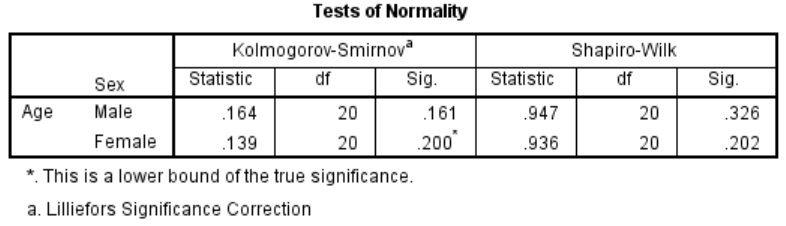 In this example, by looking at the ‘Shapiro-Wilk‘ results again, we can see that P>0.05 for both males and females ages. Therefore, both sets of data are normally distributed.
IBM SPSS version used: 23


Your example P > 0.05 (the both males and females. If these example Females P >0.05 (0.062) and Males P<0.05 (0.0032). What mean is data?
Hi Sam,
Thanks for your comment.
In that case, these results suggest the male population has non-normally distributed data. I would also suggest performing histograms or box plots to confirm this. Thus, it may be best to transform your data if you still want to use parametric tests (e.g. t-tests) or simply use non-parametric options.
I hope that makes sense.
Best wishes,
Steven
I don’t know , it is normal or non normal because we compare age between Females and Males but there are 2 P (sig) (Females p = 0.062 , Males P = 0.0032). Is age between Females and Males normal or non normal?
Usually, age is normally distributed. But this obviously depends on your experiment.
According to those normality tests, it suggests that the males age is not normally distributed.