There is a range of software and programs available to use when performing meta-analyses. Frustratingly, not all of them are free to use and some have more features than others. Below I have created a comprehensive list of freely available software, or add-ons, to use when performing meta-analyses.
Note that the list is in no particular order and I have only included those which are completely free (those offering free trials are not included). As well as the ability to create a forest plot, some of these programs have standout features which I have included. Finally, of course, you will find that all important download link.
I hope this list is useful! Be sure to leave your thoughts below and recommend any further programs that I may have missed.
Review Manager (RevMan) is a personal favourite of mine and one of the most common programs for those who are new to the world of meta-analysis. It was developed by the Cochrane Collaboration as a stand-alone program to conduct systematic reviews and meta-analysis. Creating a forest plot is relatively easy, with a guided wizard to help you through the process.
Be sure to check out my guide on entering data into RevMan if you are just starting out. Also, if you are interested in subgroup analysis in RevMan, I have also created a guide for this too.
Stand out features:
- Great for beginners
- Plenty of support available
- Risk of bias assessment tool
Metafor is one of the many R packages available to conduct meta-analyses and contains the most comprehensive analysis tools. Their website contains some very useful analysis and plot examples with the corresponding code. However, since the package requires the use of the R environment, it may be difficult for those who have never used R before to become accustomed to the package so quickly. If so – have a look at JASP or Jamovi below.
If you are new to R, I suggest taking the Introduction to R course on DataCamp (affiliate link). I used this platform to learn the basics of R before using Metafor.
Reference
Viechtbauer, W. (2010). Conducting Meta-Analyses in R with the metafor Package. Journal of Statistical Software, 36(3). http://doi.org/10.18637/jss.v036.i03
Stand out features:
- Perform meta-regression
- Excellent support and learning material
- Capable of creating numerous figures, which can be further customised
3JASP
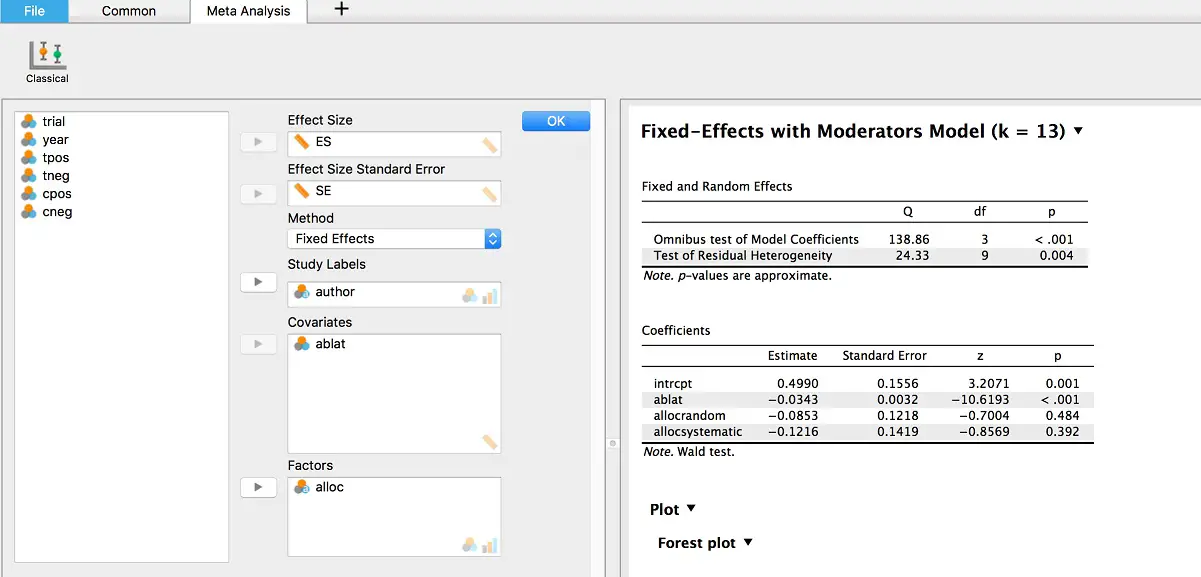
JASP is a free, open-source program used to perform statistical analysis tests by using R packages. It is a user-friendly way of conducting stats without having to deal with the R code itself. The meta-analysis function of JASP is based on the aforementioned Metafor R package. To conduct a meta-analysis in JASP, be sure to check our their guide. However, at the moment the effect sizes have to be entered into the software beforehand – JASP cannot calculate this for you. But, it is on their to-do list for future releases.
Stand out features:
- Very easy to use – no exposure to R code!
- Can do meta-regression
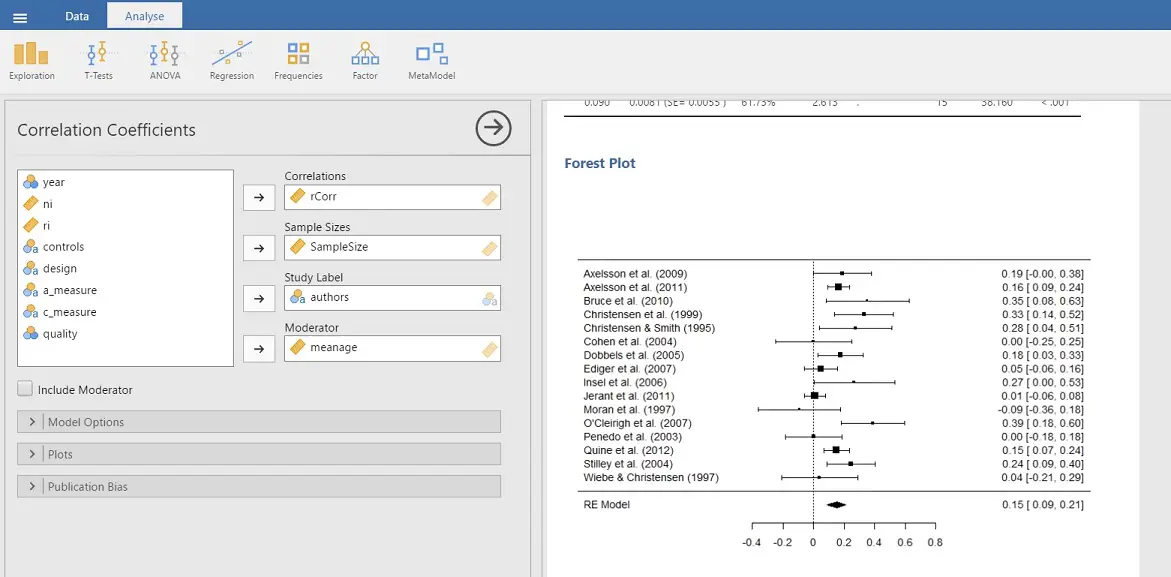
Jamovi is very similar to JASP – in fact, it shares some of the original creators. Like JASP, Jamovi uses the Metafor package in R but does all of the hard work for you. A nice aspect Jamovi is the R syntax mode, enabling the ability to see the R code which is used. Which is useful for those who understand the R language.
Stand out features:
- Very easy to use – no exposure to R code (if you don’t want to)!
- Can do meta-regression
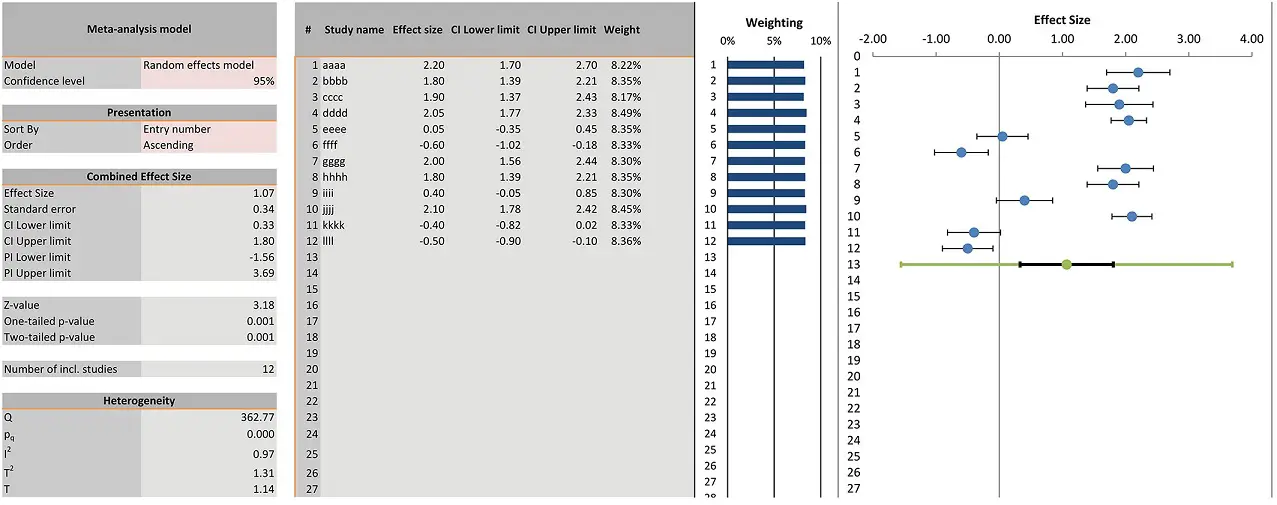
Meta-Essentials is unique in that is it simply a Microsoft Excel workbook containing example data. Simply replace the example data with your own and the formulas within the workbook will perform a meta-analysis for you. Once more, it has a detailed guide to help you through the process.
Reference
Suurmond, R., van Rhee, H., & Hak, T. (2017). Introduction, comparison, and validation of Meta‐Essentials: A free and simple tool for meta‐analysis. Research Synthesis Methods, 8(4), 537–553. http://doi.org/10.1002/jrsm.1260
Stand out features:
- No need to install additional programs
- Example data included and excellent manual

MetaXL is an Excel add-on which adds the ability to perform meta-analytical statistics within Excel. It was originally developed by Dr Barendregt, who has since passed away, but the software is still maintained.
Stand out features:
- Works within Excel
- Ability to produce doi plots – an alternative to a funnel plot when investigating publication bias
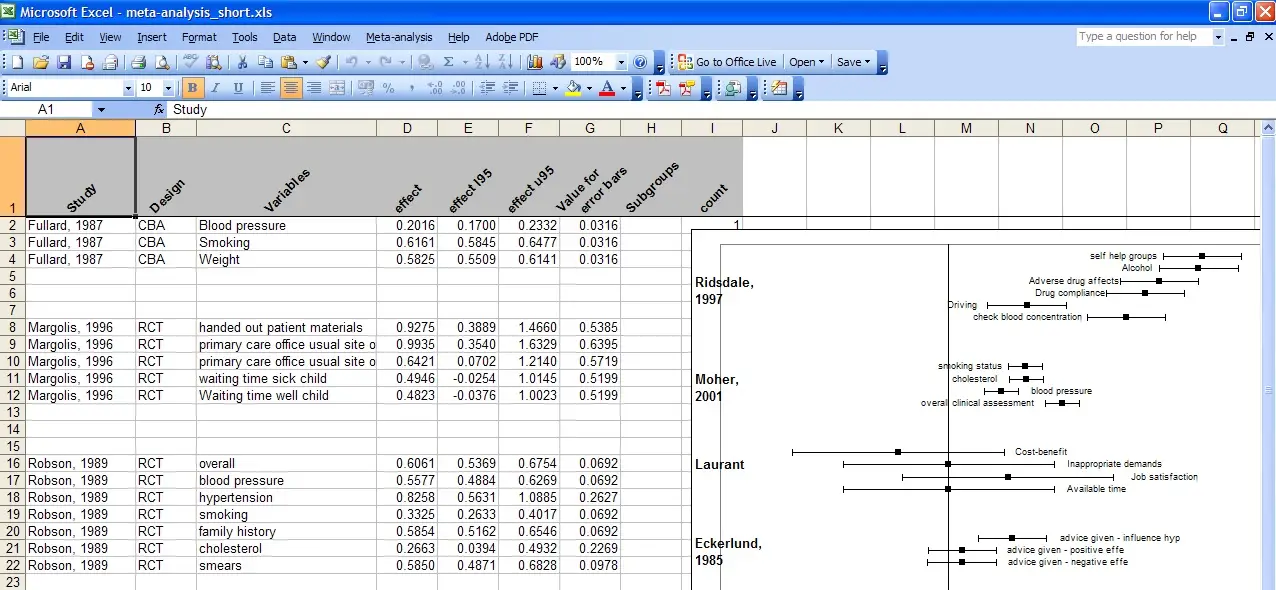
MetaEasy is anther Excel add-on which provides the ability to perform a simple meta-analysis. Unfortunately, the add-on is quite restricted in terms of functionality. For example, there are no means of creating a funnel plot to investigate publication bias.
Reference
Kontopantelis, E. And Reeves, D. (2009). MetaEasy: A Meta-Analysis Add-In for Microsoft Excel. Journal of Statistical Software, 30(7). http://doi.org/10.18637/jss.v030.i07
Stand out features:
- Works within Excel
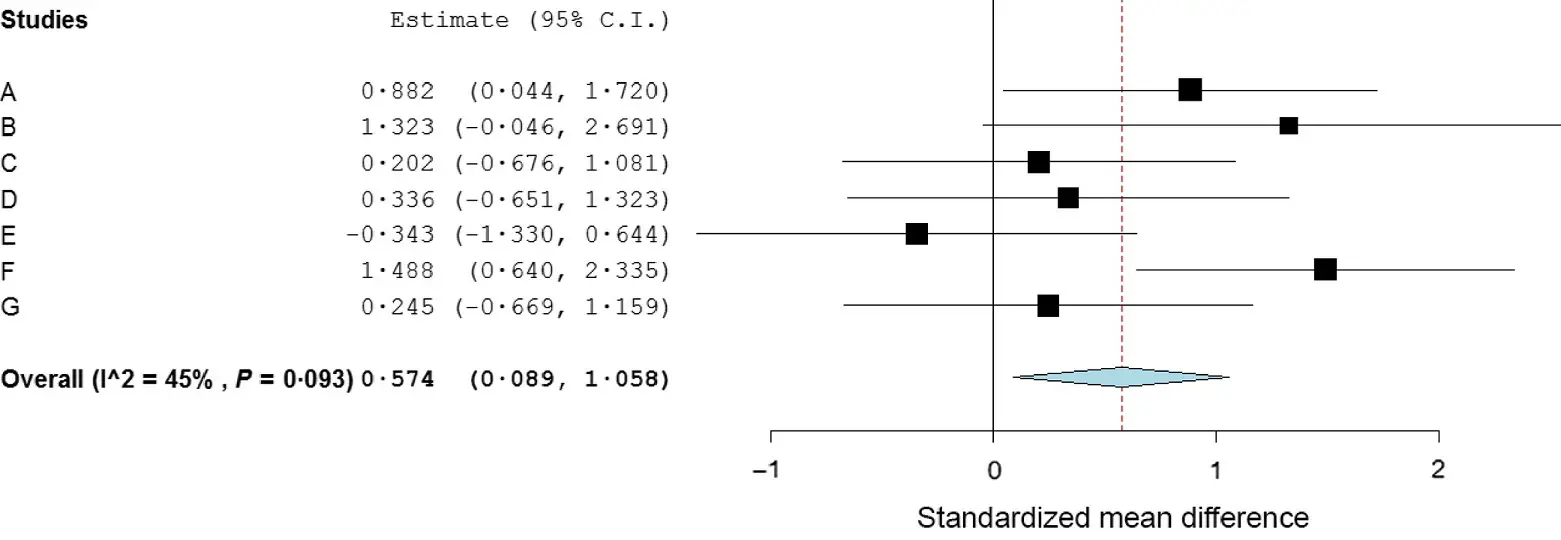
OpenMEE is a standalone meta-analysis program, particularly focussed on the ecology and evolutionary field, which runs through R. It looks and feels very similar to OpenMeta[Analyst] (see below).
Reference
Wallace, B.C., Lajeunesse, M.J., Dietz, G., Dahabreh, I.J., Trikalinos, T.A., Schmid, C.H. and Gurevitch, J. (2017) OpenMEE: Intuitive, open-source software for meta analysis in ecology and evolutionary biology. Methods in Ecology and Evolution, 8, 941-947. doi/10.1111/2041-210X.12708/full
Stand out features:
- Can do meta-regression
![OpenMeta[Analyst] for meta-analysis](https://toptipbio.com/wp-content/uploads/2018/07/OpenMetaAnalyst-for-meta-analysis.jpg)
Stand out features:
- Perform meta-regression
- Simple interface
10MetaStat
MetaStat is a DOS-based meta-analysis program that has been around since the 90’s. Although it may not be the prettiest of interfaces, it does the job.
Stand out features:
- Effect size calculator
Meta-Analysis is another DOS-based program which was developed by Ralf Schwarzer. It is quite old and hasn’t been updated in over two decades – but still, it is free!
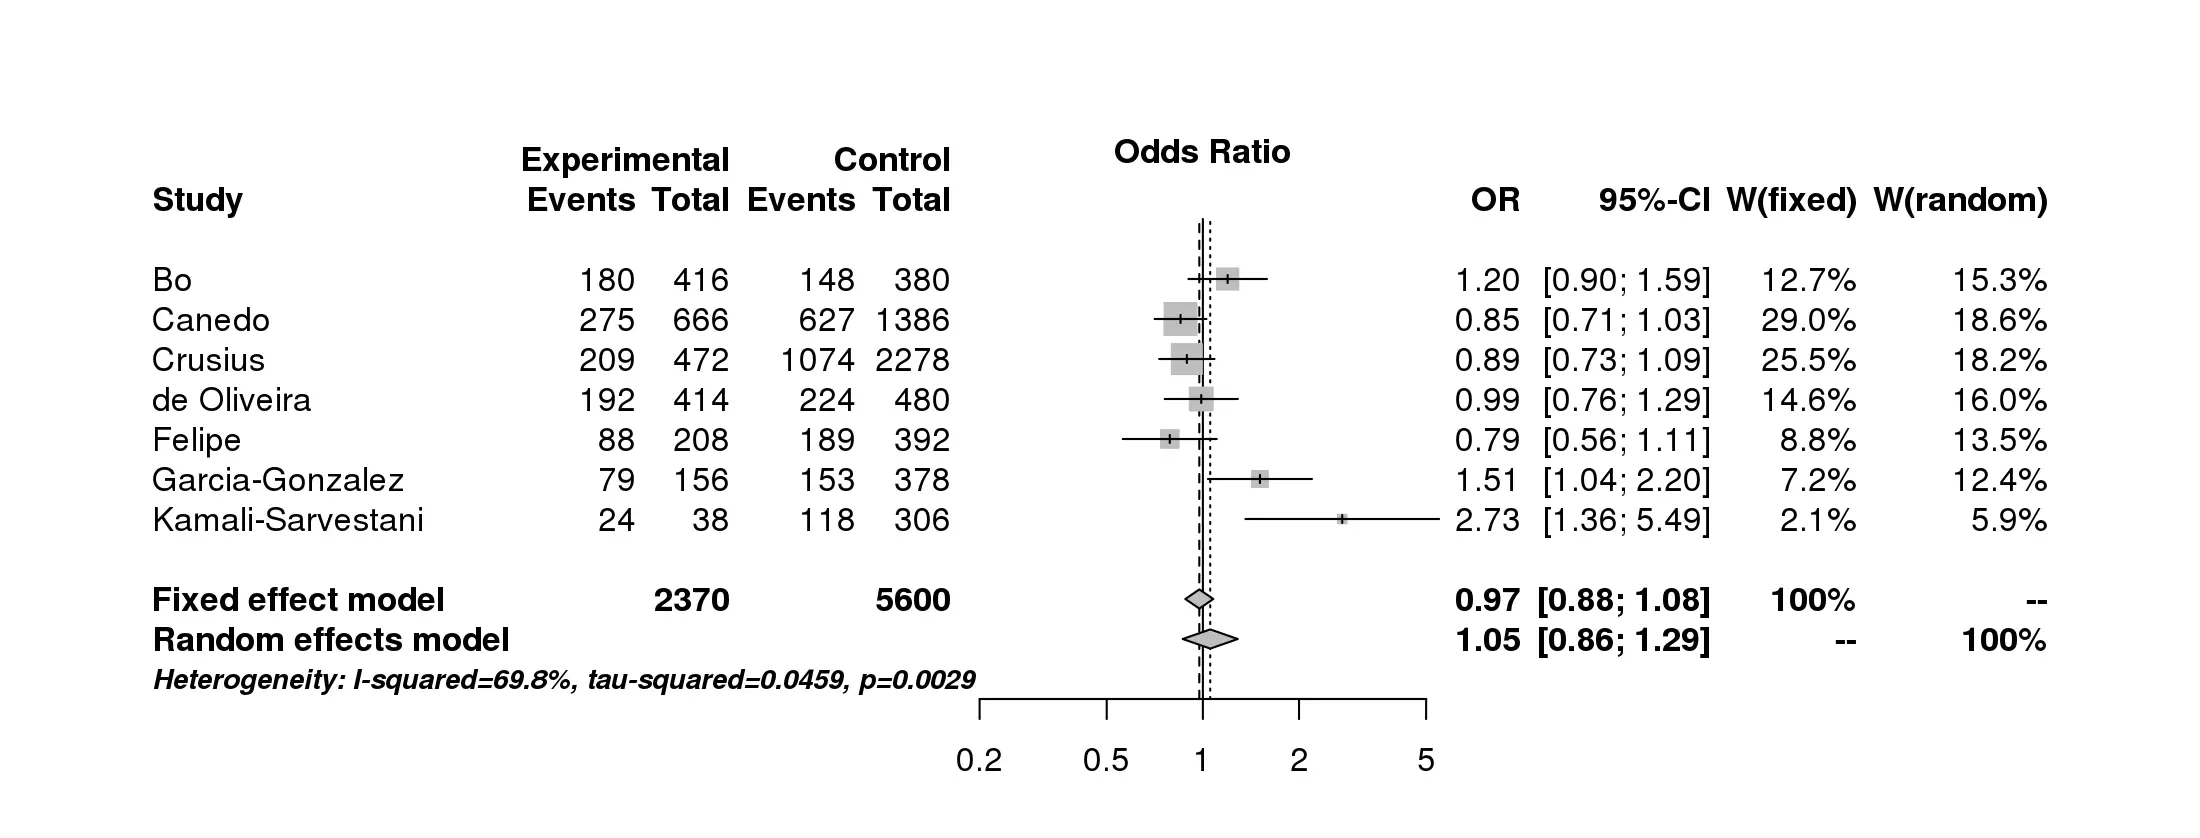
MetaGenyo is an online interface used to perform meta-analyses on genetic association studies. The interface is very easy to use. It only takes a few minutes to go from entering study data to forest plots. Certainly worth a look if genetic association studies are the focus of the analysis.
Reference
Martorell-Marugan, J., Toro-Dominguez, D., Alarcon-Riquelme, M. E., & Carmona-Saez, P. (2017). MetaGenyo: a web tool for meta-analysis of genetic association studies. BMC Bioinformatics, 18, 563. http://doi.org/10.1186/s12859-017-1990-4
Stand out features:
- Is an online interface – no need to install anything
- Simple and user-friendly
- Can handle separate genetic models (dominant, recessive)
13Other R packages
There are loads of packages in R associated with meta-analysis. For those interested in using R, it may be worth looking at the Review of Meta-Analysis Packages in R by Polanin and colleagues, who have done an excellent job in collating all of these packages.
Let me know in the comment section below what meta-analysis software you are using. If I have missed any, I will be sure to update this list.


Dear Steven,
Thank you for this compilation. Can you share some insight about the free tool to conduct a generalized linear mixed model type of meta-analysis for the proportion type of data?
Hi Tejas,
I suggest you check out the metafor package in R. This article may help you:
https://wviechtb.github.io/metafor/reference/rma.glmm.html
Hope that helps,
Steven
Hi Steven, Thank you for this precious informations. I’m doing a systematic review and I’ve already calculated the average OR and HR of different studies weighed for the sample size of the studies themselves, and now I need to calculate the 95% confidence interval of these OR and HR derived from the sum of the studies. Can I do this with RevMan5? Would you be so kind as to explain how to do it? This is my very first work in this field and I am new to statistics. Thank you very much for your time.
Hi Paola,
Many thanks for your feedback.
So, if you’re asking if RevMan can combine effect sizes to report the overall effect, then yes, it can do that. You can simply enter the raw data from the extracted studies and the software will do the rest.
Refer to this guide for more information.
Is that what you were after? Please do let me know if it isn’t, and I will try to assist further.
Thanks,
Steven
Hi Steven, Thank you for this information. I want to estimate p-value and z-test of effect sizes of individual studies. I want to do vote counting based on statistical significance of individual studies effect sizes. Which of the above software is suitable. Please advise. Thank you.
Hi Manischa,
I highly recommend using the metafor or meta R packages. I am planning on creating a course on how to performa meta-analysis in R for beginners, but this is at the planning stage.
If you understand the basics of R, these packages have very good guides on how to use them.
Best wishes
Steven
Thanks very much Steven.
I am struggling with how I am going to do a meta-analysis using observational studies (Cohort in most cases) which report exposure-effect association in beta-coefficient (β; 95%CI). Some times the outcomes are reported in percentiles, making a set of several β’s. Most of the databases I come across with, have guides on how to use common data like OR and the like. I would like to know, which database is simple and good for this kind of data or is there other simple way to use this kind of information?. I am totally beginner in statistics (may be lower) but I must to do this.
Hi William,
Many thanks for your comment.
So, I have never performed a meta-analysis using beta coeffients myself. But, it may be worth reading more into the generic inverse variance method. For this, you need an effect estimate (the coefficient) and the standard error. Since you have the 95% confidence intervals, it will be possible to calculate standard error values, which is what this method requires.
This method can be performed using RevMan, which is free and relatively easy to use. I have recently added a guide on how to set up and enter data into RevMan, which you may or may not find useful (https://toptipbio.com/enter-data-into-revman/).
I hope that helps.
Best wishes,
Steven