What is a paired t-test?
A paired t-test, also known as a dependent t-test, is a parametric statistical test used to determine if there are any differences between two continuous variables, on the same scale, from related groups.
For example, comparing 100 m running times before and after a training period from the same individuals would require a paired t-test to analyse.
Be aware that paired t-test is a parametric assessment.
The assumptions of a paired t-test
There are a few assumptions that the data has to pass before performing a paired t-test in SPSS. These are:
- The dependent variables should be measured on a continuous scale (either interval or ratio).
- There should be two dependent variables present which are measured from the same subject.
- There are no outliers present in the variables.
- The dependent variables should be normally distributed. See how to test for normality in SPSS.
How to run a paired t-test in SPSS
It is always easier understanding how to do something when applying an example. So, I will do just that by using the aforementioned example for 100 m running times before and after training.
For the dataset, each row contains the data for a different individual and the two columns refer to the before and after times (in seconds).
 For this example, the null hypothesis would be:
“There is no significant difference between the 100 m running times before and after the training period.”
The alternative hypothesis would be:
“There is a significant difference between the 100 m running times before and after the training period.”
Running the test
Now, let’s perform a paired t-test in SPSS:
- First, go to:
Analyze > Compare Means > Paired-Samples T-Test.
 2. A new window will appear. Here you need to tell SPSS which data you want to include in the paired t-test. In our case, there are only the before and after columns. Add each variable to the
 Paired Variables: input so that they are classed as pair 1. Your window should now look like this:
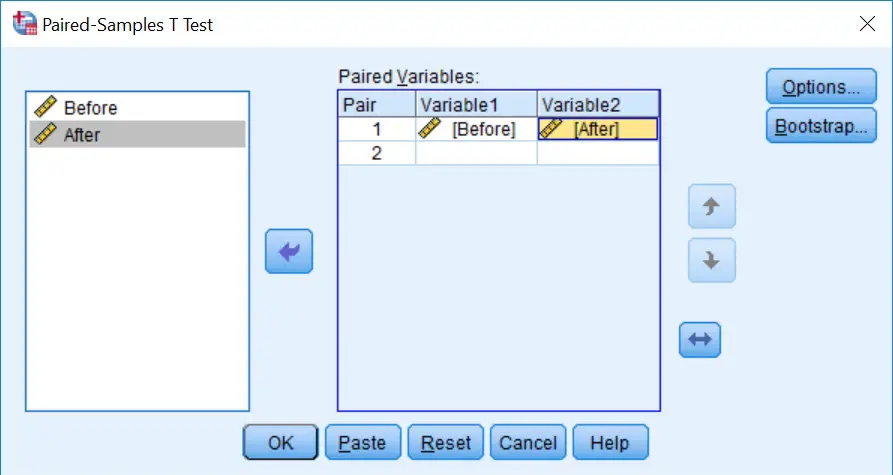 3. Ignore all the other buttons, such as
 Options and Bootstrap, we don’t need them for this. Now click the OK button to run the test.
Output
In the output window, SPSS will now give you three boxes (Paired Samples Statistics, Paired Samples Correlations and Paired Samples Test). The first box presents descriptive information about each variable (such as the mean, number of samples and standard deviation). The second box contains correlation testing between the two variables, ignore this as it is not of interest to us. We only need to look at the last box to find the results of the t-test called Paired Samples Test.
 This is the window we need for the paired t-test interpretation. There is a wealth of data here which can be broken down as:
Mean– The average difference between the two variables.Deviation– The standard deviation for the difference between the two variables.Error Mean– The standard error for the difference between the two variables.95% Confidence Interval of the Difference– The upper and lower range for the 95% confidence interval for the difference between the two variables.t– The T statistic.df– The degrees of freedom for the test. This is the number of values in the final calculation that may vary independently.Sig. (2-tailed)– The significance value (P value) for the paired test when applied a 2-tailed analysis.
Interpretation
By looking at just the Paired Samples Test box, we get a significance value (P value) of 0.000. This is not a P value of zero, rather the result is smaller than what can be presented in the SPSS table.
In other words if we have set our significance level of P<0.05, which is often the case, then the test we performed is significant because 0.000 is obviously less than 0.05.
We would reject the null hypothesis considering P<0.05 and accept the alternative hypothesis. Thus, there is a significance difference between 100 m running times before and after training.
Reporting the results
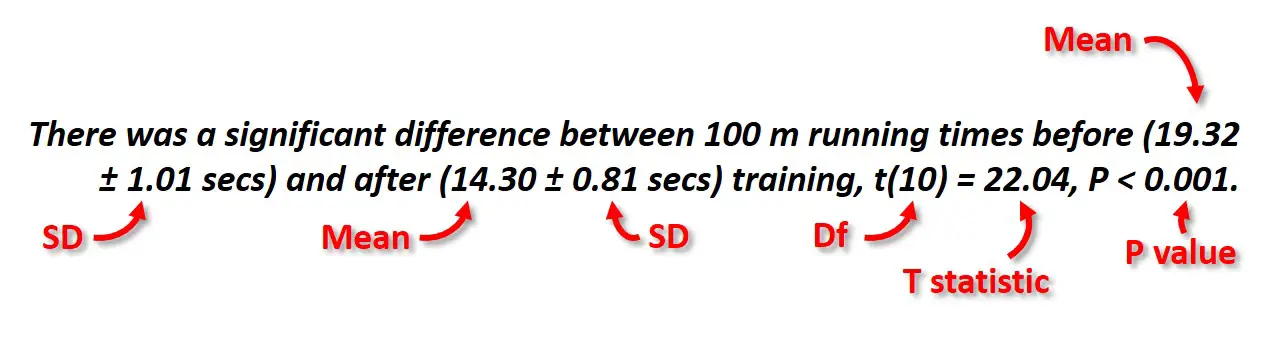
To report the results of a paired t-test in a sentence it is often useful to provide the mean and standard deviation for each of the variables so the reader can understand which group is significantly higher or lower than the other. Also, quoting the t statistic and degrees of freedom (df) alongside the P value, at the end of the sentence is more informative.
The reporting of our example would read:


ITN utilization at five sites
Site name Used ITN the previous night Did not use ITN prev night Washed the ITN before use Did not wash the ITN before use Developed adverse efffects
NK 18 32 10 8 5
CH 10 40 6 8 0
K 30 20 20 10 3
ZSH 28 22 25 3 2
N 40 10 40 0 0
D 15 35 10 5 0
what kind of statistical analysis test can I use on this data? help me analyze.
Hello,
Many thanks for your e-mail. To provide some advice, I will need some more information about the data. What exactly are these values and what is it you are interested in comparing?
Best wishes,
Steven