What is a Mann-Whitney U test?
A Mann-Whitney U test is a non-parametric alternative to the independent (unpaired) t-test to determine the difference between two groups of either continuous or ordinal data. The reason you would perform a Mann-Whitney U test over an independent t-test is when the data is not normally distributed.
Assumptions of the Mann-Whitney U test
There are just three assumptions that the data has to pass before performing a Mann-Whitney U test in SPSS. These are:
- The dependent variable should be measured on an ordinal or continuous scale.
- The dependent variable should be measured in two independent (non-related) groups.
- The distributions of the two variables must be similar in shape.
How to perform a Mann-Whitney U test in SPSS
Let’s perform a Mann-Whitney U test on some example data. For instance, say we have performed a cell culture experiment where we incubated peripheral blood mononuclear cells extracted from controls and individuals who suffered from rheumatoid arthritis. We performed an enzyme linked-immunosorbent assay (ELISA) on the media after 24-hours to determine the concentration of Protein X.
We want to know if there is a significant difference in Protein X concentrations between the control and rheumatoid arthritis cells after 24-hours.
The null hypothesis would be:
“There is no difference in Protein X concentrations from the media of peripheral blood mononuclear cells extracted from controls and those with rheumatoid arthritis.”
The alternative hypothesis would be:
“There is a difference in Protein X concentrations from the media of peripheral blood mononuclear cells extracted from controls and those with rheumatoid arthritis.”
In SPSS we have two data variables: a continuous (scale) variable called ‘Protein_X_concentration‘ and a group (nominal) variable called ‘Treatment‘. The treatment group is coded so that ‘1‘ signifies the control group and ‘2‘ indicates the rheumatoid arthritis group:
 Performing the test

Below is a description of how to perform a Mann-Whitney U test in SPSS.
- Firstly, go to
Analyze > Nonparametric Tests > Legacy Dialogs > 2 Independent Samples....
 2. A new window will open. Here you need to move the dependent variable (
Protein X concentration in the example) into the window called Test Variable List. Also, move the variable containing the grouping information (Treatment group) into the box titled Grouping Variable:
 3. Next, click the
 Define Groups... button. Here you need to tell SPSS which groups will be involved in the analysis. So enter ‘1‘ next to Group 1 and ‘2‘ next to Group 2. Then click the continue button.
 4. Finally, ensure that the
 Test Type has Mann-Whitney U ticked (it usually is by default) and click the OK button to run the test.
Output
Go to the output window in SPSS to view the results. You should see two boxes under the title Mann-Whitney Test:
 The first (
Ranks) gives you an indication of which group’s mean Protein X concentration is larger than the other. In this case, the rheumatoid arthritis group had a Mean Rank of ‘17.00‘ as opposed to the ‘8.00‘ in the control group.
To determine if there is a statistically significant difference between the two groups, you need to look in the Test Statistics box. The Mann-Whitney U value refers to the Mann-Whitney U statistic. For those all-important P values, these are given next to the Asymp. Sig. (2-tailed) and Exact Sig. [2*(1-tailed Sig.)] for a two- and one-tailed test respectively.
Interpretation
In this case, we are interested in a two-tailed analysis, since we did not specify in our hypothesis which group would be higher than the other. Therefore, we look at the Asymp. Sig. (2-tailed) value which is ‘.002‘. Since .002 is less than our desired significance threshold (P<0.05), we reject the null hypothesis and accept the alternative hypothesis.
Reporting
When reporting data that is not normally distributed, it is more appropriate to quote the group median and the quartile range (25th and 75th percentiles), as opposed to the mean and standard deviation. This is because the data in the groups are skewed, so reporting the mean would be misinformative.
Here is how to get the median, 25th and 75th percentiles for each group in SPSS:
- Go to
Analyze > Descriptive Statistics > Explore....
 2. In the new
 Explore window, move the dependent variable (Protein X concentration) into the Dependent List box and the grouping variable (Treatment group) into the Factor List box. This is telling SPSS to give us the descriptive statistics for the Protein X concentration and to separate the outputs by the treatment group:
 3. While still in the
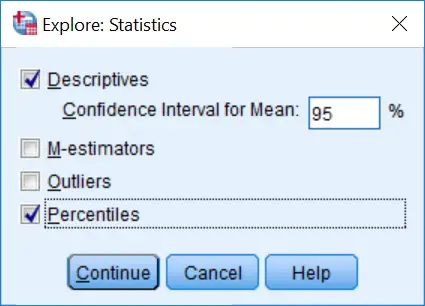
 Explore window, click the Statistics... button. You want to tick the Percentiles option:
 4. Then click the
 Continue button and next the OK button in the original Explore window to run the command.
5. Now if you go to the SPSS output window, you will see multiple boxes of descriptive statistics. Scroll down to the one with the heading Percentiles:
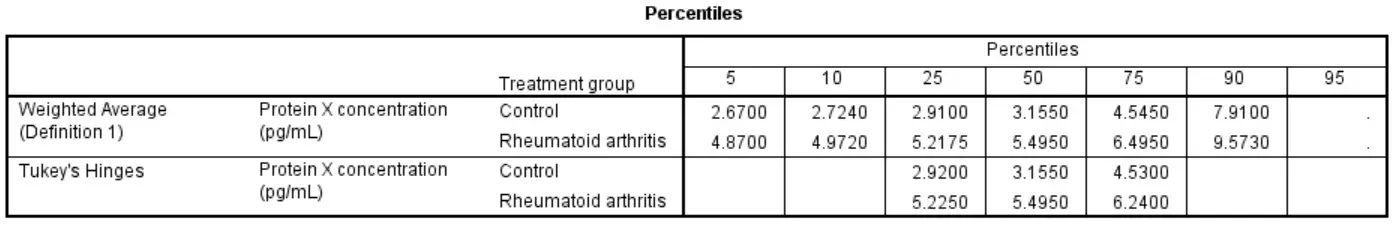 What we are interested in is the data in the
 Weighted Average (Definition 1) row. The 50 percentile indicates the median values. The 25th and 75 percentiles (also known as quartiles 1 and 3) are also indicated under the 25 and 75 headings.
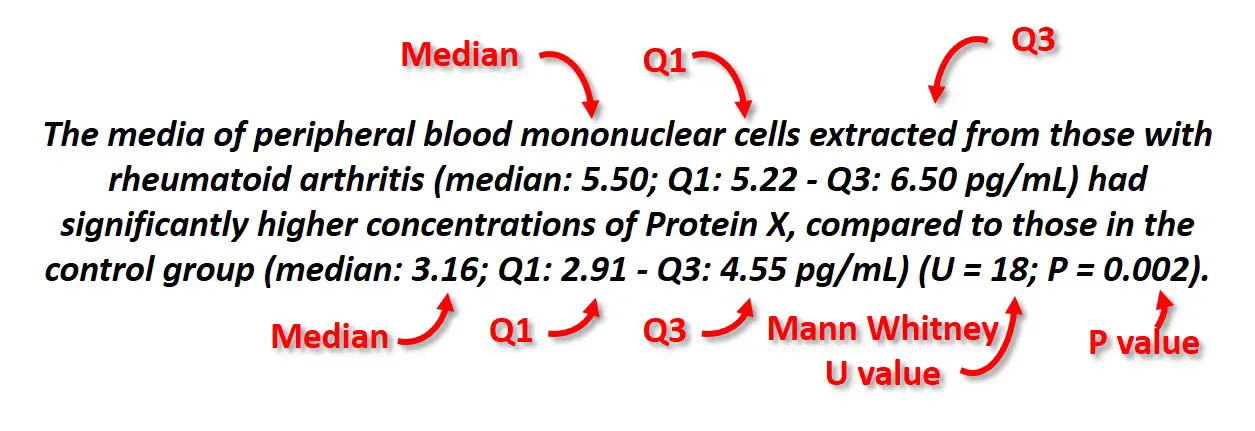
Now, back to the reporting of the results. If you were to report these results as a text, it would be convenient to state the median and quartiles 1 (25th percentile) and 3 (75th percentile) after each group, as well as the Mann-Whitney U statistic followed by the P value at the end of the sentence.
For example, we could write:
IBM SPSS version used: 23


